Curated OER
Exploring Gender Bias in the Workplace
Pupils investigate gender bias in the work place. In this secondary mathematics lesson, students gather research on the current statistics about a profession which focuses on the female//male ratios and the pay scale of the females...
Curated OER
Performance-Based Assessment Practice Test (Grade 6 Math)
Keep track of your sixth graders' mastery of the Common Core math standards with this practice assessment. Taking a different approach than most standardized tests, this resource includes not only multiple choice questions, but also free...
Bowland
In the Olympics, are Women Improving Faster than Men?
Will the time come when women outperform men at the Olympic Games?Scholars investigate gender differences in Olympic Games performances. They study the historical participation of women and then analyze data to determine if women will...
Curated OER
Closing the Salary Gap
Students explore careers in their community and compare the average salaries for men and women working in those careers. They explore a variety of careers available in their community through participating in this lesson.
Curated OER
Social Studies, Gender and the Blues
This lesson shows how the blues can be used to enable students to explore gender divisions in the United States, both in the past and the present. Most blues songs are about the relationships between men and women, as are many songs in...
Curated OER
Infusing Equity Vs Gender into the Classroom
Students explore the effect of gender bias in the classroom. In this statistics lesson, students discuss the effects of stereotyping, discrimination, and gender bias in the classroom. They collect data on different work places dealing...
Curated OER
Gender and Income
Students investigate Income and gender preference. For this statistic lesson, students collect data of Income to see if one gender makes more than the other. Students examine the data and draw conclusions.
Curated OER
Mathematics in Various Carees
Learners consider gender equity in mathematics careers. Students will view 12 15 minute episodes on future math careers then discuss that particular career as well as how women have been treated in both traditional and non traditional...
Curated OER
Gender Issues through Chi-square Experiments
Pupils investigate teachers and gender preference. In this statistic lesson, students collect data of teachers calling on pupils to see if they are calling on one gender more than the other. Students examine the data and draw conclusions.
Curated OER
The Average Kid
Students determine the traits they have in common with other students in the class and create visual profiles of the "average" boy and the "average" girl.
Curated OER
How Many?
Establish 1:1 correspondence by counting students, first one gender, then the other. Give each child a colored cube (one color for boys, another for girls) and have small groups determine more or less and how many all together. As a...
EngageNY
Conditional Relative Frequencies and Association
It is all relative, or is it all conditional? Using an exploration method, the class determines whether there is an association between gender and superpower wish through the use of calculating conditional relative frequencies. The last...
CK-12 Foundation
Two-Sided Stem-and-Lead Plots: Gamers
Which gender spends more time playing video games? Your classes use provided data to answer this question. They first build a two-sided stem-and-leaf plot and then use the display to look for patterns. Guiding questions help them...
Learning Games Lab
Nitrogen in Fertilizer
Nitrogen is an essential element for productive farming. An interactive lesson explores the chemical makeup of different fertilizers and their corresponding nitrogen content. The interactive challenges individuals to complete molecular...
Curated OER
comparison of Two Gender Sports Teams
Students gather data on sports team and create a box and whisper plot. In this data collection lesson, students find the median, the quartile range, and relationships between variables.
PBS
The Lowdown — Examining California's Prison System: Real-World Ratio
Free yourself from the shackles of traditional math lessons. Young mathematicians investigate race, gender, and age differences in California's prison system. They use provided graphics to compare the prison population with the state's...
Curated OER
Comparison of Two Different Gender Sports Teams - Part 1 of 3 Measures of Central Tendency
Students gather and analyze data from sports teams. In this measures of central tendency instructional activity, students gather information from websites about sports team performance. Students analyze and draw conclusions from this...
Curated OER
Comparison of Two Different Gender Sports Teams - Part 3 of 3 Scatter Plots and Lines of Best Fit
Students create a scatter plot for bivariate data and find the trend line to describe the correlation for the sports teams. In this scatter plot lesson, students analyze data, make predictions,and use observations about sports data...
Curated OER
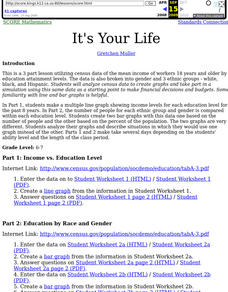
It's Your Life
Students make a multiple line graph showing income levels for each education level for the past 8 years and the number of people for each ethnic group and gender is compared within each education level.
Curated OER
Heredity Mix 'n Match
Learners randomly select jelly beans that represent genes for several human traits such as tongue-rolling ability and eye color. Then, working in pairs (preferably of mixed gender), students randomly choose new pairs of jelly beans from...
Curated OER
Line Graphs
In this line graphs worksheet, 8th graders solve and complete 20 different problems that include reading various line graphs. First, they use the information provided in each line graph to determine the correct response to each of the...
Curated OER
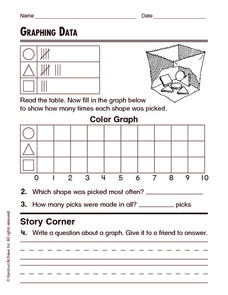
Graphing Data
In this graphing data worksheet, students solve and complete 8 different word problems related to graphing data given. First, they determine the percent of people who do not believe in any of the phenomena described and explain. Then,...
Project SMART
Exploring the History of Mathematics
Students research six different mathematicians using Internet resources. They examine the contributions of different cultures, women, and one that made a significant to geometry. They present their research to the class.
Curated OER
Women in the Labor Force
Students examine the differences men and women experience in the work force. They study the relationship between education and the likelihood of employment.


