Hi, what do you want to do?
Curated OER
Capture/Recapture
Students use proportions to estimate the size of populations. They describe the data with using a graph or table of the estimate. Students use descriptive statistics to calculate mean, median, and mode. They also compare and contrast an...
Curated OER
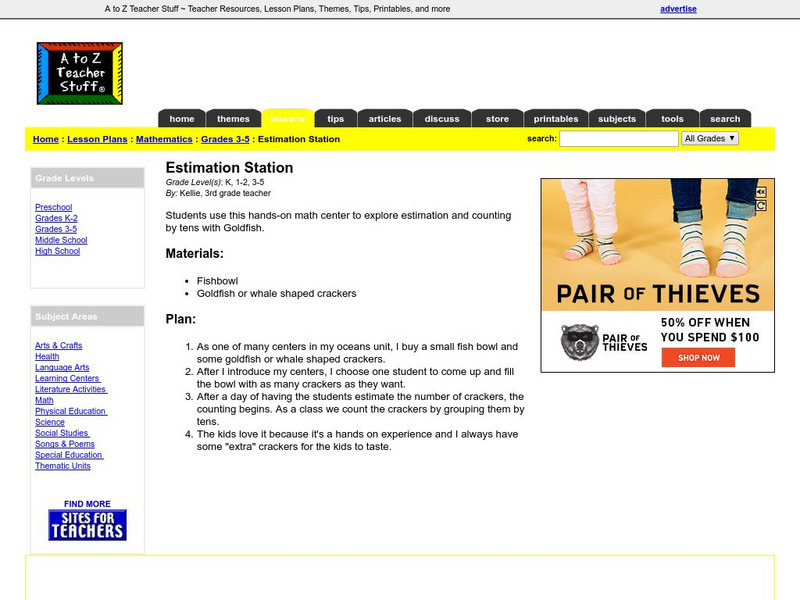
Estimation Station
Students use this hands-on math center to explore estimation and counting by tens with Goldfish.
Curated OER
Add Using a Hundred Chart
For this adding practice worksheet, learners sharpen their problem solving skills as they solve 6 story problems using a hundred chart.
Curated OER
Addition and Subtraction Word Problems
In this problem solving worksheet, 2nd graders use addition and subtraction to solve 2 word problems about fish. They show their work and answer in the word space next to the problem.
Curated OER
Rates and Ratios
In this rates and ratio worksheet, students determine the ratio for a given situation. They use proportions to solve problems. This two-page worksheet contains 4 multi-step problems. Answers are provided on the last page.
Curated OER
Something Fishy (Statistics)
Students are introduced to a problem involving an environmental issue. They are introduced to the capture-recapture method which involves capturing fish, tagging them, returning them and recapturing another sample. Pupils work in...
Curated OER
CATCH, TAG and RELEASE
Students apply estimation strategies for problem-solving purposes. They become familiar with one aspect of a marine biologist's work.
Curated OER
Seven Rates and Ratio Problems Using Tables
In this rates and ratios worksheet, students complete tables given rates. This worksheet contains seven multi-part problems where students discover the steps to ratio problems.
Curated OER
Healthy Snacks. Healthy Packaging
Fourth graders research how to select the most cost-effective snacks. In this consumer practices lesson, 4th graders compare packaging labels and come to conclusions on how cost effective the product is. Students discuss their findings.
Curated OER
Wildlife Sampling
Seventh graders discuss water issues and its affect on salmon population. They recreate a sampling river with fish (cheddar) and scoop them to tag them (which means they exchange them for pretzel fish.) They complete a spreadsheet to...
Curated OER
Understanding 1/3
In this understanding fractions instructional activity, students read about fractions and respond to 16 multi-step, word problem, and fill in the blank questions.
Curated OER
Estimation 2: Sum and Difference
In this estimation worksheet, pupils mentally solve eight multiple choice problems involving addition and subtraction. They arrive at their answers through the process of using compatible numbers or rounding. Students read story problems...
Curated OER
Sums With 9
In this sums with nine worksheet, 1st graders calculate the sums of nine in ten sets of red dots, calculate the answers to twenty five addition equations.
Curated OER
Lake Pepperidge Farm
Learners calculate proportions to determine the total population of Lake Pepperidge Farm. They collect a blind sample of fish and count the number of tagged and untagged fish. They collect data from all samples and record the data in a...
Curated OER
Wildlife Sampling
Seventh graders use paper bags and crackers to simulate a wildlife sampling of salmon. They record data on spreadsheets and determine a formula to estimate salmon populations.
A to Z Teacher Stuff
A to Z Teacher Stuff: Estimation Station (Lesson Plan)
A hands-on lesson plan for grades K-3 on estimation using goldfish crackers. Lesson used in conjunction with an oceans unit.


