Curated OER
Frequency Tables and Stem-and-Leaf Plots
Students are introduced to the function of frequency tables and stem and leaf plots. In groups, they determine the frequency of their teacher coughing, ringing a bell or raising their hand. To end the lesson plan, they determine...
EngageNY
Ferris Wheels—Tracking the Height of a Passenger Car
Watch your pupils go round and round as they explore periodic behavior. Learners graph the height of a Ferris wheel over time. They repeat the process with Ferris wheels of different diameters.
Curated OER
As the Wheel Turns
This is not your typical Ferris wheel problem. In this exercise, your class will combine their knowledge of sinusoidal functions as well as linear motion to come up with parametric equations that model the position of a point on the edge...
Virginia Department of Education
Mathematics Vocabulary Cards - Grade 2
Augment your math curriculum with posters detailing several concepts important to second grade math. Each poster features one math term from geometry, measurement, probability and statistics, computation and estimation, numbers and...
Curated OER
Applications of Derivatives: Concavity and Optimization
In this derivatives worksheet, students sketch the graph of a function by determining the local maxima, minima and inflection points. They graph a second function when given the interval. Students solve two word problems involving...
Inside Mathematics
Rugs
The class braids irrational numbers, Pythagoras, and perimeter together. The mini-assessment requires scholars to use irrational numbers and the Pythagorean Theorem to find perimeters of rugs. The rugs are rectangular, triangular,...
Curated OER
Math Games for Skills and Concepts
A 27-page packet full of math games and activities builds on algebra, measurement, geometry, fractional, and graphing skills. Young mathematicians participate in math games collaboratively, promoting teamwork and skills practice.
Curated OER
Bubble Gum Chemistry
Learners explore the concept of graphing data. In this graphing data lesson plan, students determine the percentage of sugar in bubble gum. Learners graph type of gum vs. sugar percentage. Students create a table of their data.
Curated OER
Round and Round and Round We Go!
Students investigate motion using a CBL. In this algebra lesson, students collect and graph data on a coordinate plane. They define and identify amplitude and period of conic graphs.
Curated OER
Investigating Transformations
In this trigonometry worksheet, students investigate the transformations that can occur to the basic trigonometric functions. The thirteen page worksheet contains explanation, examples, and forty-seven...
Curated OER
Conic Sections
Students, while using a graphing calculator, graph systems of conic sections as well as identify their solutions. They complete various word problems dealing with conic sections with their calculators. In addition, students sketch graphs...
Curated OER
Graphs And Ellipses
Students become acquainted with linear graphs, the parabola and the rectangular hyperbola. Also prepare tables of paired values as preparation for plotting a line. They study the cartesian equation of an ellipse, with a worked example.
Curated OER
Discovering Pi
Students develop a formula that describes the functional relationship of the circumference of a circle to its diameter. Working with a partner, they measure the diameter and circumference of circular objects in order to discover the...
Curated OER
Cruising the Internet
Students identify the parts of an engine using a graph. In this statistics lesson, students make a graph from their collected data. They calculate the volume of a cylinder using a line of regression and a scatter plot.
Curated OER
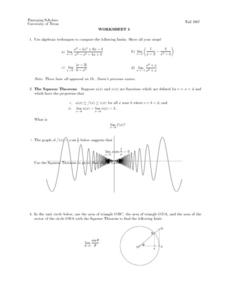
Worksheet 5 - Squeeze Theorem
In this Squeeze Theorem worksheet, students compute limits, identify a graph that represents the Squeeze Theorem, and graph given functions. This two-page worksheet contains seven multi-step problems.
Curated OER
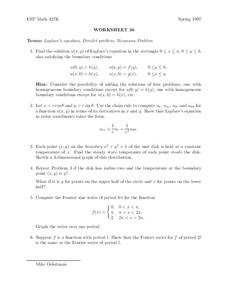
Worksheet 36
In this math worksheet students find the solution u(x,y) of Laplace's equation in a given rectangle with specified boundaries. Students use the chain rule to compute values for a function and relate this answer to Laplace's equation....
Curated OER
Worksheet 7 - Asymptote
In this asymptote worksheet, students compute limits, graph vertical asymptotes, and find the slope of the secant line. This one-page worksheet contains six multi-step worksheets.
Curated OER
Implicit Differentiation Problems
In this calculus worksheet, learners perform implicit differentiation to take the derivative. They solve function explicitly of x. They differentiate between implicitly and explicitly. There are 16 problems with an answer key.
Curated OER
Worksheet 15-Fall 1995
In this math worksheet students use the intermediate value theorem to solve two problems. They find parallel lines that will cut a convex shape into two pieces with equal areas. Students repeat this problem with a concave shape. Students...
Curated OER
Orbital Bliss
Most young mathematicians are aware that the planets don’t orbit the sun in a circle but rather as an ellipse, but have never studied this interesting feature. This resource looks at the planetary orbits in more detail and helps learners...
Curated OER
Count on Me
Fourth graders use inductive reasoning to find algebraic patterns in geometric figures. They use technology (i.e., calculators, computers) and manipulatives to discover number patterns involving geometric concepts. They solve concrete...
Curated OER
A Cylinder Workshop
Students work with given formulas to solve for specific variables. The calculation of the volume of a cylinder and the change in volume when there is a constant surface area is analyzed in this lesson.
Curated OER
Trigonometry Ratios
Students identify the different angles and sides of a triangle. In this geometry lesson, students identify the six trigonometric ratios. They graph the graph of each trig function and analyze it.
Curated OER
Taylor Polynomials
Pupils graph Taylor polynomials in this calculus lesson. They observe the graphs for the expansion of Taylor polynomial functions and use the Ti calculator to help create visuals of the graphs.

