Texas State Energy Conservation Office
Investigation: Greenhouse Effect
Pupils compare the temperature change in a closed and open box as a demonstration of the greenhouse effect.
Curated OER
Forest Activity: Interpreting a Graph
Students research forest growth online. They analyze the parts and contents of a graph, then summarize in narrative form the changes in the forest over time.
Curated OER
Using Current Data for Graphing Skills
Students graph demographic information. In this graphing lesson plan, students choose what type of graph to create and what information to display. Links to examples of graphs and statistical data are provided. The graphs are created on...
Curated OER
Impossible Graphs
Students distinguish between possible and impossible graphs of functions, and to learn why some graphs are impossible. They have practiced plotting functions on the Cartesian coordinate plane
Curated OER
Graphing Current Drug Data
Students increase understanding of the drug issue and further develop skill in graphing.
Curated OER
Graphs
Students list their favorite cars and create graphs of their favorites. Students determine how the graphs would change as their choices change.
Curated OER
Graphing: Ocean Floor
Students graph the ocean floor using given data. For this earth science lesson, students label different oceanic features on the map. They answer questions at the end of the lab.
Curated OER
The Classroom Desk Graph
Second graders choose the appropriate measuring tool by discussing a tool to measure contents in desks. They then use a scale to weigh contents in desks.
Next, they study standard units of measurement by writing down the weight in...
Curated OER
Creating and Analyzing Graphs of Tropospheric Ozone
Students create and analyze graphs using archived atmospheric data to compare the ozone levels of selected regions around the world.
Curated OER
The Classroom Desk Graph
Second graders discuss appropriate units of measure to use when weighing the contents of their desks. They use a scale to weigh different items from their desks. They write down weight in pounds and graph the results using an online...
Curated OER
Shared Reading: Greedy Cat's Breakfast
Pupils explain they need food to live and grow. They discuss their favorite breakfast foods. They create a graph of breakfast foods.
Curated OER
Shhh, Be Quiet, We're Trying to Read
Students practice spelling, sounding out, and identifying the "sh" digraph. Students listen as the teacher reads a tongue twister emphasizing words with the "sh" sound. Students listen to the story "Is Joe Home?" and identify the words...
Curated OER
Researching Another country's Holiday: Organizing and Recording Information
Prior to this lesson, 5th graders will have collected notes from several sources. Students extend their note taking to include at least one example each of summarizing and paraphrasing. They record bibliographic information for each...
Curated OER
M & M Madness
Second graders graph M & M's by color. In this graphing lesson plan, 2nd graders first predict how many of each color they think are in a handful of M & M's. Then they graph the amounts of each color on a computer program....
Curated OER
Snow Cover By Latitude
Students create graphs comparing the amount of snow cover along selected latitudes using data sets from a NASA website. They create a spreadsheet and a bar graph on the computer, and analyze the data.
Curated OER
Know the System
Learners identify the different systems of equations. In this algebra activity, students solve systems of equations using graphing, elimination and substitution. They use the Ti to graph their systems.
Curated OER
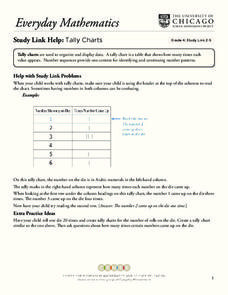
Tally Charts
For this tally charts worksheet, students discuss how to use a tally chart and how to read the chart. Once students record information on a tally chart they answer questions showing their ability to read a tally chart.
Curated OER
Tally Chart Practice
In this tally chart worksheet, students will read about tally charts and their uses. Students will make a list of when and why they could make a tally chart. Next students will complete a tally chart and write statements about the...
Curated OER
Celebrating the Solstice and Equinox
Fourth graders graph the number of daylight hors throughout the year and examine why day length varies. They discover that seasonal changes and latitude on Earth affect the number of hours of daylight in each day. Students listen to...
Curated OER
Rock art
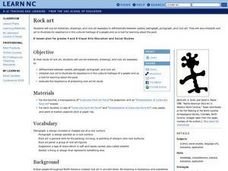
Students study rock art they use art materials, colored photographs and rock art examples to: differentiate between symbol, petroglyph, pictograph, and rock art. They interpret rock art to illustrate its importance in the cultural...
Curated OER
Taming the Mighty Dragon
Pupils incorporate the five themes of geography to study the Yangtze river region. They analyze the possible effects of the three rivers gorge damn project on this area and role play a float the entire length of this dangerous river...
Curated OER
WORLD GEOGRAPHY
Students identify and analyze map symbols and map grids by completing various worksheets and creating their own map using these skills. Students identify and analyze what latitude and longitude are on a map to play a game of Bingo....
Curated OER
Country Locations
First graders read a story and locate where the countries in the story are located. In this traditions lesson, 1st graders explore food dishes from different countries and discuss where they are located. Students tell their favorite...
Curated OER
Bus Graph
Young scholars make predictions about which bus takes the most/least students in the classroom. They use KidPix bus stamp for each student who goes home on that bus number and record data and discuss predictions.


