Computer Science Unplugged
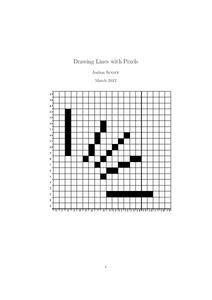
Drawing Lines with Pixels
How do the computers keep it straight? Using the provided algorithms, class members draw a line and a circle using pixels. They then check the drawings using a straight edge and compass to determine the accuracy of their...
Curated OER
Animal Brains
Do big bodies make big brains? Let your learners decide whether there is an association between body weight and brain weight by putting the data from different animals into a scatterplot. They can remove any outliers and then make a line...
Teach Engineering
Matching the Motion
It is not always easy to walk the straight and narrow. In the sixth portion of a nine-part unit, groups actively recreate a graph depicting motion. Individuals walk toward or away from a motion detector while trying to match a given...
Illustrative Mathematics
Robot Races
Analyze data on a graph to answer three questions after a robot race. Learners practice comparing ratios and reading points on a graph. Answers may vary on the last question based on accuracy of graphing. Use the lesson along with...
Curated OER
Linear and Quadratic System
Learners find the common point of a linear and quadratic system given a graph of the system. Then they find a specific point located only on the parabola.
Marshall Cavendish International
Coordinate Plane Treasure Hunt
Similar to the game Battleship®, partners try and determine where the opponent buried their treasures on the hidden coordinate plane. Two types of planes are provided, one with only quadrant one and one with all four for a higher...
Illustrative Mathematics
Half of a Recipe
Kids love to cook! What is a better place to learn mixed numbers than with a recipe? It is up to learners to decide how they want to divide this recipe in half. They may choose to model the mixed number and then divide the model by two....
Lawrence Hall of Science
The Math Page: Skill in Algebra: The Equation and Graph of a Straight Line
Here is a site that clearly and thoroughly explains the equation of a line, including how to find points on a line, intercepts, and how to recognize the equation of a line. There are example problems solved, problems for the student to...
Texas Instruments
Texas Instruments: Walk the Line: Straight Line Distance Graphs
In this activity, students' use a motion detector to create straight-line, or constant-speed, distance versus time plots, and analyze the linear equation that describes the plots.
Texas Instruments
Texas Instruments: Tight Rope
In this activity, students examine quantities that are linearly related and can be visually represented using a straight-line graph. Students collect distance versus time data using a motion detector and find a model for the...
San Diego State University
San Diego State University: Allometric Modeling
This site shows how to use exponential graphs to model AIDS cases. Very detailed site.
Texas Instruments
Texas Instruments: Linear Functions: Slope as Rate of Change
Students learn to associate the slope of a straight line with a constant rate of change. They also learn to calculate the rate of change from data points on a line, using the correct units. Students also learn to read from a linear...


