Curated OER
Persuasive Elements
Investigate letters to the editor and their persuasive qualities. Break your class into reading groups and give each one a different article. As they read, they complete a graphic organizer to record their thoughts and opinions. There is...
Curated OER
Histograms and Statistical Graphics
In this statistics worksheet, students solve 6 data problems. They construct a histogram of given data, they create a frequency polygon, and a stem and leaf diagram. Students create a dot plot and a pie chart for given data sets. On the...
NASA
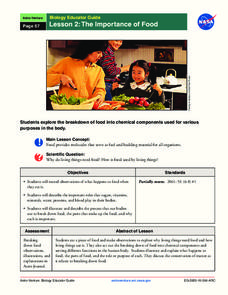
The Importance of Food
Pupils make observations while eating food. They act out the process of food breaking down in the body and the roles of various chemical components, such as sugar and protein. It concludes with an activity illustrating the process and a...
NASA
Producers Make Their Own Food
During an inquiry-based lesson, scholars decide which variable to test and then design an experiment to determine the needs of producers. After two weeks, they complete a full analysis and research paper.
Curated OER
Sequencing
Students consider how cause and effect translate into sequencing in literary works. In this sequencing lesson, students read non-fiction passages about Eleanor Roosevelt and Clara Barton. Students complete graphic organizers based on...
Curated OER
Story Summaries; The Three Little Pigs
Young scholars explore language arts by completing a graphic organizer in class. In this story structure lesson, students read the classic tale "The Three Little Pigs" and discuss the main characters, conflict and setting. Young scholars...
Curated OER
Using Text Features
Fourth graders read a nonfiction story that is presented to them with graphic features, and presented to them with only the text. In this text features lesson plan, 4th graders decide what the benefits of text organizers are and create...
Curated OER
Mathematics and Football
Learners analyze information represented graphically. In this third through fifth grade mathematics lesson, students apply mathematical knowledge to solve real-world problems relating to the Super Bowl. The activities involve number...
Curated OER
Investigating Native Plants
Learners explore Earth science by participating in a gardening activity. In this botany lesson, students discuss a group of non-native plants that would grow well in a school garden. Learners complete a plant science graphic organizer...
Curated OER
In Celebration of the Silk Road
Sixth graders explore the ancient trade routes of the Silk Road with a focus on a province in China to identify artifacts and research how these items arrived in the city of Turpan.
Curated OER
Screaming for Ice Cream
Mathematicians investigate maximizing volume by learning to explore the problem in which they seek to maximize the volume of a cone. Students solve the problem symbolically, graphically, and through the use of integration or...
Curated OER
"M&M's"® Candies Worksheet 2
In this math worksheet, young scholars plot the mean, median, and mode for the colors of M and M candies by filling in the graphic organizer.
Curated OER
Alternate Tide of Change Worksheet
In this space science worksheet, students look up the mass of the sun and moon. They graph the results with the graphic organizer and answer the questions that are related.
Virginia Department of Education
Analyzing and Interpreting Statistics
Use measures of variance to compare and analyze data sets. Pupils match histograms of data sets to their respective statistical measures. They then use calculated statistics to further analyze groups of data and use the results to make...
Ohio Department of Education
Observe Then Infer
To develop their skill at drawing inferences from observations, sixth graders rotate through six stations, conduct a series of experiments, make observations, and draw inference from what they observe.
Code.org
Using Variables in Apps
Investigate the benefits of using global variables. The seventh installment of a 21-part unit continues the study of variables from the previous lesson. Young computer scientists modify two existing apps by adding variables and learn how...
Code.org
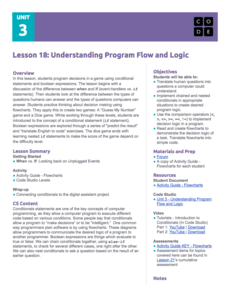
Understanding Program Flow and Logic
Explore decision-making logic in programming computer games. The 10th installment of a 21-part unit teaches scholars how to apply conditional statements and Boolean expressions. They use these concepts to create a "Guess My Number" game...
Concordia College Archives
Introduction and Student Inquiry
Introduce young musicians to the history of and different styles of music with an inquiry-based learning activity that asks them to play detectives to determine the similarities and differences among the sheet music found at a series of...
Curated OER
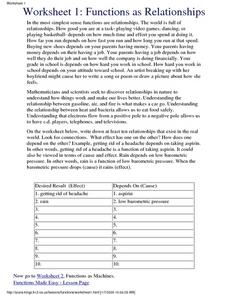
Functions As Relationships
In this algebra worksheet, students read the information about the relationships of functions and then they fill in the graphic organizer with the information at the bottom of the page.
Curated OER
Worksheet 2: Functions as Machines
In this algebra worksheet, students read about the concept of functions and how to apply them. Then they fill in the graphic organizer with the right type of functions.
Curated OER
Monthly Cost of Living Grocery List
In this economics worksheet, 4th graders find the cost of grocery items and compute the total cost per month for buying them in the graphic organizer.
Curated OER
Graphic Geography
Young scholars investigate a foreign language. Then by looking at a map they identify ten major geographic features. Students conduct research to find information. The geographical area is then presented in the foreign language as a...
Curated OER
No Bias Allowed
Students differentiate graphical representations looking for the bias. They use a systematic process in order to solve problems. Students explain how a problem is solved and the steps involved. Even deeper than this is giving the...
Curated OER
The Roarding 20's
Tenth graders are introduced to the social, economic and political developments of the 1920s. Using historical developments that are part of the indicator, they create a three-dimensional graphic organizer.


