US Department of Agriculture
Sink or Float?
Will it sink or will it float? Learners predict the outcome as they drop random objects into a container of water. Then, they keep track of the results and record the data in a t-chart to draw a final conclusion.
Curated OER
Foliage Tracker
Young scholars discuss the change of leaf colors and the role that climate and elevation play in those changes. They then track leaf changes, input data, and graph foliage changes with a free online tool.
Curated OER
Fast Food Survey Using Bar Graphs
Second graders create a bar graph to pictorically represent the data collected from a survey of students. They use Excel to electronically create the graphs and data tallies. They then interpret their data using sentences to explain.
Virginia Department of Education
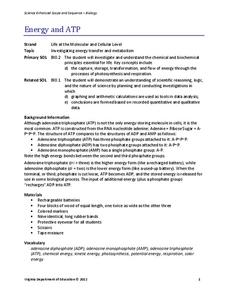
Energy and ATP
Take charge of your biology class by using this exciting analogy to relate the ATP process with batteries. Pupils use batteries and rubber bands to simulate the phosphate bonds between molecules in the body. They measure the distance in...
Curated OER
Graphing Pendulum Results
Sixth graders set up a pendulum experiment deciding which variable to manipulate (length of string or weight on the string). They create a hypothesis, collect necessary equipment, and write out each step of their experiment. They then...
Curated OER
Weather
Students create a spreadsheet and chart using data collected. In this weather instructional activity, students select five cities from their state, including the city they live in. Students take daily temperature readings...
Curated OER
All That Corn
Students observe and record data. In this plant growth lesson, students plant and grow corn. Students observe the growth of their corn and record their data. Students read corn recipes and select their favorite four...
Curated OER
When Dinosaurs Ruled the World
Students graph the varying sizes of dinosaurs. In this math and dinosaur lesson, students view dinosaur models and compare the different shapes and sizes of the dinosaurs. Students complete a dinosaur math activity, read The...
Curated OER
Billions of Bubbles
Students conduct an experiment with bubbles. In this observation and comparison lesson, students read Bubbles, Bubbles, Everywhere and conduct an experiment where they test different kinds of liquids to see which is the best for a...
Curated OER
Tracking Data Using Quickoffice on a Palm Handheld
Sixth graders keep track of the amount of garbage they threw away over 3 days time. They graph and analyze data and participate in discussions. They draw conclusions based on their data.
Curated OER
Temperature High and Lows
Young scholars gather high and low temperature readings through email. In this temperature graphing lesson, students use a spreadsheet to input data for a graph. young scholars interpret the graphs to compare and contrast the data from...
Curated OER
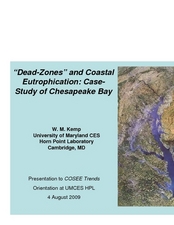
"Dead-Zones" and Coastal Eutrophication: Case-Study of Chesapeake Bay
Take an in-depth look at nutrient loading, eutrophication, and hypoxia using data on The Chesapeake Bay as an example. This comprehensive presentation includes detailed graphs, photos, and details about the changes in marine organism...
Curated OER
Weather Lesson
Students discuss the weather conditions. They read thermometer, rain gauge, barometer, and wind direction and speed. They record observations of weather conditions and enter information into data base on the computer.
Curated OER
How Safe Is Your Backyard?
Seventh graders investigate the safety of soil and water locally and communicate via the Internet with students in different locales sharing information. They research the Internet using its multimedia capabilities and collate the data...
Curated OER
Using a Statistical Procedure To Search A Database For Out of the Ordinary Values
Students develop a spreadsheet containing formulas and find summaries for them. In this investigative instructional activity students choose a topic, investigate it and use MS Excel to sort data.
Curated OER
Exploring The Depths!
Fifth graders make a model of the ocean floor. In this ocean characteristics lesson plan, 5th graders complete a KWL chart about the ocean floor, use the Ocean Depth Data Sheet to create a graph, and create a 3-D model of the ocean...
Curated OER
Toy Dissection Graph
Students explore simple machines and how they are made. They examine the parts of the simple machine and collect information about its parts. Using Excel, students create circle and bar graphs from the collected data.
Curated OER
Is the Hudson River Too Salty to Drink?
Students explore reasons for varied salinity in bodies of water. In this geographical inquiry lesson, students use a variety of visual and written information including maps, data tables, and graphs, to form a hypothesis as to why the...
Curated OER
Fin, Feathers, or Fur?
Students learn how to classify animals. In this animal characteristics lesson, students read Granddad's Animal Alphabet Book, brainstorm a list of different kinds of animals, and determine their characteristics; fur, feathers or scales....
Curated OER
Control Mechanisms
Students explain how a feedback control system works. They model a feedback control mechanism for controlling water level by observing the flow rate of water in a cylinder. In addition, they graph their data. Script for lesson is included.
Curated OER
Testing Battery Combinations
Fourth graders examine the required combinations of plates and predict which combination will generate the most and least current and voltage. They use an ammeter and experiment with combinations of their own testing and record each...
Curated OER
Alzheimer's Disease
Investigate Alzheimer's disease. Conduct research using a variety of resources, obtain information, and input the data into a Microsoft Excel spreadsheet. Identify trends in the data and categorize them for an audience.
Curated OER
Hermit Crab Races
Students predict the speeds of humans and hermit crabs and investigate their predictions using ratios and formulas. AppleWorks is used for this lesson, which includes a data worksheet.
Science 4 Inquiry
The Yin and Yang of Photosynthesis: Day vs. Night
Floating fragments of elodea can grow even without roots. Young scientists use eldoea plants to observe the oxygen production from photosynthesis. They study the difference between having access to high amounts of light and low amounts...


