BW Walch
Creating and Graphing Linear Equations in Two Variables
This detailed presentation starts with a review of using key components to graph a line. It then quickly moves into new territory of taking these important parts and teasing them out of a word problem. Special care is...
CCSS Math Activities
Smarter Balanced Sample Items: High School Math – Target C
Let units pave the way to success. A set of five questions in a helpful PowerPoint presentation highlights the SBAC Claim 1 Target C high school item specifications. It covers the use of units to steer solutions, identifying appropriate...
Curated OER
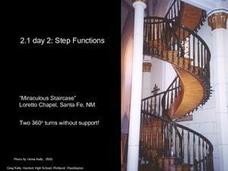
Calculus 2.1 day 2 - Step Functions
"Step functions" are sometimes used to describe real-life situations. This extensive lesson with many practice examples demonstrates two such functions: the Greatest Integer Function and the Least Integer Function. The commands on the...
CCSS Math Activities
Smarter Balanced Sample Items: 8th Grade Math – Claim 2
Math can be a problem in eighth grade. Sample items show how problem solving exists within the eighth grade standards. Part of the Gr. 8 Claim 2 - 4 Item Slide Shows series, the presentation contains eight items to illustrate the...
Curated OER
Intersecting Graphs
Ninth graders know how to solve a system of linear equations, but what happens when the system involves an exponential function? The instructional slideshow teaches viewers to determine solutions to systems of equations with linear...
BW Walch
Solving Systems of Linear Equations
Solving systems of equations underpins much of advanced algebra, especially linear algebra. Developing an intuition for the kinds and descriptions of solutions is key for success in those later courses. This intuition is exactly what...
CCSS Math Activities
Smarter Balanced Sample Items: 8th Grade Math – Claim 4
A math model is a good model. A slide show presents 10 sample items on modeling and data analysis. Items from Smarter Balanced illustrate different ways that Claim 4 may be assessed on the 8th grade math assessment. The presentation is...
CCSS Math Activities
Smarter Balanced Sample Items: High School Math – Target L
Functions are for forming context models. A PowerPoint file contains 11 questions for learners to answer. It covers the high school SBAC Claim 1 Target L item specifications and requires interpreting functions, determining appropriate...
BW Walch
Solving Linear Inequalities in Two Variables
Although graphing a linear inequality on the plane is but a few steps added onto the graphing of a linear equation, for many learners the logical leap is quite intimidating. This approachable PowerPoint presentation breaks graphing...
Annenberg Foundation
Skeeters Are Overrunning the World
Skeeters are used to model linear and exponential population growth in a wonderfully organized lesson plan including teachers' and students' notes, an assignment, graphs, tables, and equations. Filled with constant deep-reaching...
BW Walch
Creating and Graphing Exponential Equations
Frequently found in biology and economic application problems, exponential equations show up as stars in this introductory presentation. Taking no background or knowledge of exponentials for granted, the slides walk learners...
Curated OER
Calculus 10.2 day 2 - Vector Valued Functions
Looking for a lesson on vectors? Here is a PowerPoint that has six examples for finding velocity, acceleration, speed and direction of motion. One of the examples demonstrates the use of the TI-89 Graphing Calculator to solve a...
Curated OER
Read and Write Numbers up to 100,000
Use this lengthy, and challenging, presentation in your lesson on numeracy. Pupils practice their skills in reading and writing numbers up to 100,000, interpret a variety of graphs, solve word problems, and get to use a calculator. A...
Curated OER
Area and Perimeter
Another good presentation by Christine Berg is here for you. In it, learners are coached on definitions of area and perimeter and are shown how to perform calculations for both. They also see how to calculate the area of a triangle by...
Curated OER
Timetable Problems
Learning how to read a schedule and determine when you will depart and arrive is an everyday skill that builds competency in chart reading, subtraction, elapsed time, and counting on. Learners discuss how to solve timetable problems and...
Curated OER
Where a Shape Will be After Two Translations
Show your class some ways to calculate shape translation. They can consider seven shapes on a coordinate grid. Then, they must turn the shapes on the grid given a set of directions on the slides. I would use this for practice or review.


