Alabama Learning Exchange
Creating a Reflection
Investigate geometric reflections in this geometry lesson. Create geometric reflections that show the reflection across the x and y axis of a coordinate graph. Learners watch a teacher demonstration before proceeding on their own. They...
Curated OER
Reflections
Tenth graders perform reflections on different geometric shapes. In this geometry worksheet,students define the concept of geometric reflections and find the coordinates of the reflection on a coordinate grid.
Curated OER
Carbon Monoxide and Population Density
Tenth graders investigate the carbon monoxide level at a fixed latitude to determine if there is a relationship to population density. They download data sets and generate a graph, and find locations using the Earth's coordinate system....
Curated OER
Let's Go Slopey
Young scholars create a table of values to graph a line. In this algebra lesson, students identify the slope and intercept of a linear equation. They use a Ticalculator to graph their function.
Curated OER
Make a Design by Plotting Points
Students plot points on graph paper to make designs. They color their designs.
Curated OER
A Christmas Project
Seventh graders publish a letter and spreadsheet using the computer. They build a three-dimesnsional object with construction paper and develop a Christmas object using coordinates on a graph. Students compose a response in their journals.
EngageNY
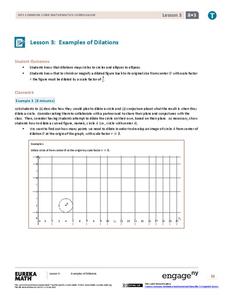
Examples of Dilations
Does it matter how many points to dilate? The resource presents problems of dilating curved figures. Class members find out that not only do they need to dilate several points but the points need to be distributed about the entire curve...
Curated OER
Graphs And Ellipses
Students become acquainted with linear graphs, the parabola and the rectangular hyperbola. Also prepare tables of paired values as preparation for plotting a line. They study the cartesian equation of an ellipse, with a worked example.
Curated OER
Graphs and Functions
Pupils are introduced to plotting functions on the Cartesian coordinate plane seen several categories of functions, including lines and parabolas
Curated OER
Graphing System of Equations
Students solve system of equation. In this algebra lesson, students graph, substitute and eliminate to solve system of equation. They identify the point of intersection and how many solution each system will have.
Curated OER
VARIABLES AND PATTERNS, USE AFTER INVESTIGATION THREE. DISCRETE OR CONTINUOUS LINEAR RELATIONS.
Students discover for which kind of linear function is appropriate to use the "scatter" or the "connected" term. In this instructional activity, students investigate functions using variables, patterns book, graph paper, rulers and the...
Curated OER
Solving Systems of Equations
Students identify the quadrants and axis of a coordinate plane. In this algebra lesson, students discover the ocrrect way to graph using the coordinate plane. They discuss the relationship between x and y values, domain and range and...
Curated OER
Exploring Transformations
Young scholars investigate functions and their transformations. They move absolute value functions around on the coordinate plane, and then define the transformation and plot the new graph. The table feature of the TI-calculator is used...
Curated OER
Slope-Intercept Form of a Line
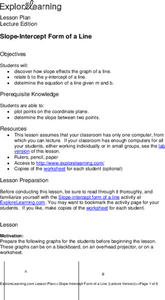
Students determine how the slope affects the graph of a line. They relate "b" to the "y"-intercept of a line and solve the equation of a line given "m" and "b." They are given scenarios and possible answers to which they explain why or...
Curated OER
Mine Shaft Grade 8 Slope
Eighth graders investigate slopes using real life scenario. In this algebra lesson, 8th graders model and interpret real life data. They plot their data in a coordinate plane and discuss the results with the class.
Curated OER
Conic Sections
Students explore the different properties of conics. In this algebra lesson, students calculate the midpoint of a line, the distances between two points as they get ready to find the focus and directrix in eclipse and other conics. They...
Texas Instruments
2B or not 2B a Functions
Learners use their graphing calculators to view graphs of equations. They tell if each equations is or is not a function and are shown pre-set graphs on their graphing calculators. They use the Quick Poll feature to indicate if the graph...
Curated OER
TI-Nspire Activity: What Does Your Representation Tell You?
By learning to select the best representation for three meal plans, students compare three meal plans to determine the best choice. Data for the meal plans is sorted on a table, as an algebraic equation, and graphed on a coordinate grid....
Texas Instruments
Mean Value Theorem
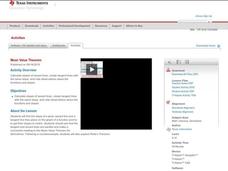
High schoolers calculate the slopes of secant lines. In this calculus instructional activity, students graph tangent and secant lines using the coordinate plane. They use the Ti calculator to graph and observe the lines.
Curated OER
2D Grpahing Functions
In this algebra worksheet, 9th graders graph linear equations using a line. They find values for x and y and plot them on a coordinate plane to make a line. There are 6 questions.
Curated OER
Zeros of a Quadratic Function
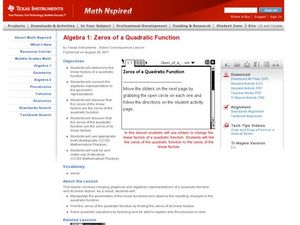
Factor quadratic equations by teaching your students how to identify the zeros of the quadratic function. They use the TI to see where the graph will intercept the coordinate plane.
Curated OER
Polynomial Rollercoaster
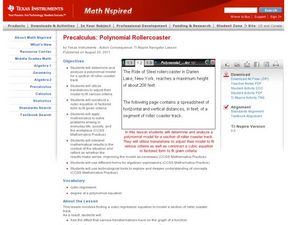
Learners relate polynomials to a rollercoaster track as they translate a graph around on a coordinate plane. They differentiate between different forms of algebraic expressions.
Curated OER
Graphing Ordered Pairs
In this math worksheet, students learn to graph ordered pairs. Students examine a graph with 3 labeled points and tell the ordered pairs for each. Students also plot 8 ordered pairs on a graph they draw themselves.
Curated OER
Rational Function Graphs
Pupils use algebraic methods to represent and solve problems. Using a graphing calculator, students solve rational and inequality problems. They visually demonstrate solutions of functions through graphing. Pupils answer questions...
