College Board
2010 AP® Calculus BC Free-Response Questions Form B
Keep moving along a curve. Two items in the set of released free-response questions from the 2010 AP® Calculus BC exam involve movement along a graph. One involves particle motion along a polar curve while the other uses a squirrel...
Curated OER
Standard Linear Form
Ninth graders identify and describe the x-intercept as the place where the line crosses the x-axis as it applies to football. They create their own differentiations to reinforce the distinction between the x-intercept and the...
Curated OER
Graphing in an Experimental Context
Seventh graders discuss the importance of being able to represent scientific data in the form of graphs. They comprehend the differences between a bar graph and a line graph. Students identify the type of data with which each graph...
Curated OER
Graphing 3 Ways
In this graphing worksheet, students graph 10 equations using the following methods: slope-intercept form, x- and y-intercepts, or by using a table. Students check their work using a graphing calculator.
Curated OER
Reading Graphs
Students practice plotting functions on the Cartesian coordinate plane, see several categories of functions, including lines and parabolas, and read a graph, answering questions about the situation described by the graph
Curated OER
Graphing Linear Equations with Calculator
Students graph lines using the calculator. In this algebra lesson, students graph lines of equations in the form y=mx+b. They input equations into the TI Calculator and graph using the slope and intercept. They analyze the graph for...
Curated OER
Graphing in the Form of Bar Graphs
Students explore bar graphs. In this math lesson, students create and conduct a survey. Students graph their data in a bar graph.
Curated OER
Topic 2.2 - Graphing Linear Equations
In this linear equation worksheet, learners write 9 linear equations in Standard Form. They then find the x and y-intercept of the graph of each of 6 equations. Finally, students graph 6 equations on the blank graphs provided on the page.
Curated OER
Graphing Scatterplots
Students examine scatterplots and determine the equation of a line using the slope-intercept method. Students interpret graphs, draw inferences, and sketch a curve of best fit for the graph. Based upon patterns in the graphs, students...
Curated OER
Graphing systems of inequalities
In this graphing worksheet, students graph ten systems of inequalities. Students are then asked to find the area of the regions. A challenge problem is included. where students are asked to find the volume of the resulting...
Curated OER
Graphing Using Cookies
Young scholars differentiate between bar graphs, line graphs, pictographs and bar graphs. After participating in a hands-on cookie activity, students label and draw their own graphs.
Curated OER
Systems of Linear Inequalities in Standard Form -- Lecture
Learners participate in a lecture about linear inequalities. Individually, they graph different inequalities and describe its solution. They participate in a demonstration in which they solve a system of inequalities and complete a...
Curated OER
Graphs
Eighth graders analyze graphs on a worksheet and in newspapers and magazines. In this graphs lesson plan, 8th graders also record their thoughts in a journal.
Curated OER
Histograms and Bar Graphs
Learners are introduced to histograms, bar graphs, and the concept of class interval. They use an activity and three discussions with supplemental exercises to help students explore how data can be graphically represented (and...
Curated OER
Seized Before Flights: Graph
In this bar graph worksheet, learners analyze a graph that show the number of prohibited items intercepted at U.S. airport screening checkpoints. Students answer 3 problem solving questions about the data on the graph.
Curated OER
More Graphing With Intercepts
In this graphing worksheet, young scholars graph linear equations. They identify the x or y-intercept. Coordinate planes are available below each equation. Nine problems are provided on this two-page worksheet.
Curated OER
Favorite Season Circle Graph
Students create a graph charting their favorite season. They discuss the difference in the four seasons and activities they participate in, in each of the seasons. They can also take a survey of their family members and add them to the...
Curated OER
Eighteen Slope-Intercept Form of a Line problems
For this line worksheet, students solve eighteen problems related to slope, t-intercept, and equations of lines. Three of the problems are multiple choice, two are graphs, and the rest are free-response problems.
Curated OER
Practice Graphing y = mx + b
Ninth graders graph linear equations of the form y= mx + b. In this algebra lesson, 9th graders are able to graph a line given the slope and y-intercept. They can write the equations of a line given the graph of a line and can...
Curated OER
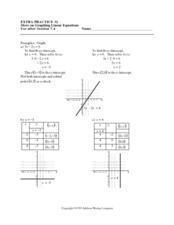
More on Graphing Linear Equations
In this graphing worksheet, students graph linear equations, identify the x or y-intercept. Graph paper is provided below each equation. There are nine problems on this two-page worksheet.
Curated OER
Lines, Lines, Everywhere
Students explore linear equation suing real life scenarios. In this algebra lesson, students find the slope and intercept of a line. They create table of values to plot their graph and draw conclusions.
Curated OER
What is the Average Height of Your Class?
For this statistics lesson, learners use an on-line form generator create a class-specific form, then complete the form, view a graph and data analysis, and draw conclusions.
Curated OER
Quadratic Equations and Functions
This comprehensive lesson plan reviews solving and graphing quadratic functions and functions of higher degree. Using the vertex form of a quadratic functions, one finds the vertex, minimum or maximum, and axis of symmetry. A few...
Curated OER
Three Methods for Using Quadratic Functions to Model Data
In this modeling data worksheet, students use quadratic functions to model data using three different methods. This worksheet provides explanations and an example. Additionally, students are given the steps to find the...


