CK-12 Foundation
Graphs Using Slope-Intercept Form: Mountain
Climb every mountain, even one you create in an interactive. Individuals solve a problem involving slopes and distances of campsites on a mountain. Answering a set of challenge questions aids in the process.
CK-12 Foundation
Roller Coaster
Roller coasters rely on both kinetic and potential energy, but how much total energy does a roller coaster need? Scholars vary the mass of a coaster and the height of the initial hill. Graphs showing the types of energy and total energy...
CK-12 Foundation
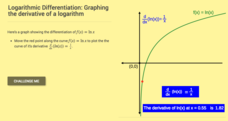
Logarithmic Differentiation: Graphing the Derivative of a Logarithm
Log the values of the derivative of a logarithm. The interactive plots the derivative of the natural logarithm. Learners first determine the derivative of natural logarithm and the general logarithm. Using the formulas for the...
Curated OER
Convert Standard Form to Slope-Intercept Form
Ninth graders convert between the standard form of an equation and the y-intercept form. For this algebra lesson, 9th graders rewrite equations from their standard form into the y=mx + b form. They solve for y using the distributive...
Curated OER
Graphing Quadratic Equations
Review the form of a quadratic function, and the parabola it creates. Continue on with the whole group to work through a mini-lab, practicing how to graph quadratic equations with one variable. The goal of this instructional activity is...
Curated OER
Graphing and Interpreting Linear Equations in Two Variables
Graph linear equations using a table of values. Learners solve equations in two variables using standard form of an equation. They identify the relationship between x and y values.
Curated OER
Solving Linear Systems by Graphing
A worksheet that offers four problems to practice solving simultaneous equations by graphing. Equations are presented in slope-intercept form or standard form. Problems include two with unique solutions, one with no solution, and one...
Curated OER
Graphing Linear Equations with Two Variables
Can your class solve linear equations in two variables? They will be able to after they engage in this lesson. Individuals graph linear equations in two variables using slope and intercept and identifying the relationship between the x...
Curated OER
Introducing y = mx + b
Middle and high schoolers use the slope intercept form to graph a line. In this algebra lesson, pupils rewrite equations from standard form to y-intercept form. They use the slope and y-intercept to graph a line without making a table of...
Curated OER
Writing Equations in Slope-Intercept Form
Use this worksheet to write equations in both point-slope form and slope-intercept form. Start by writing equations given one point and the slope and finish by writing equations given two points and a few real-world applications. The...
Curated OER
Choose The Appropriate Graph
Fifth graders work in groups to investigate the proper use of a graph during a schoolyard ecology project. The challenge of the project is for students to choose the proper form of a graph. They gather data and conduct analysis with the...
Curated OER
Graphing Quadratic Equations with a Coefficient of One
This is a teacher page for a lesson and does not include any materials to support the lesson. High schoolers graph quadratic equations with a coefficient of one and create a table of values to graph a quadratic equation. They plot the...
Curated OER
Aerosol Lesson: Science - Graphing SAGE II Data
Students examine and plot atmospheric data on bar graphs.
Curated OER
Yummy Math
Young mathematicians use bags of Skittles to help them gain practice in graphing and organizing data. They work in pairs, and after they have counted and organized their Skittles, they access a computer program which allows them to print...
Curated OER
Parent Functions Review Sheet
No laundry or cooking dinner here: these parent functions are all about math. Every graph you could think of from basic linear functions to the hyperbolic arccotangent function are included. With 40 parent functions, the worksheet...
CPO Science
Physics Skill and Practice Worksheets
Stop wasting energy searching for physics resources, this comprehensive collection of worksheets has you covered. Starting with introductions to the scientific method, dimensional analysis, and graphing data, these skills practice...
Curated OER
Solar Kit Lesson # 12 - Calibration Curve for a Radiation Meter
Scientists need to have mastered algebraic slope-intercept concepts in order for this lesson to be effective. They will measure and graph solar panel output as a function of the amount of radiation striking it, discovering that there is...
Curated OER
Agriculture and the Government
Students study the government's involvement in the U.S. A's food production and make connections relating to farm programs. In this historical agriculture lesson, students read content and research significant information....
Curated OER
Quadratic Equations with the CBL 2
Learners practice generating parabolas with a motion sensor while determining the vertex form of the equation. They compare it to the regression equation from the calculator onto a data mate software. Each student completes several...
Curated OER
Graphing With a Spreadsheet
Fourth graders review how to create bar, line and circle graphs. Using jelly beans, they collect data and present it in a bar graph form. They enter the same data into a spreadsheet and watch as the program creates the same graph. They...
Curated OER
Graphing Valentine Candies
Fifth graders organize and display information in bar graph form using appropriate labels. Each student receives a box of Valentine heart candies, a worksheet of the tally chart and a worksheet of the bar graph.
Curated OER
Solving Systems by Graphing
In this solving systems by graphing learning exercise, 9th graders solve and complete 5 different problems. First, they change each equation to graphing form. Then, students graph each line and find their point of intersection. In...
Curated OER
Graphing Linear Equations Using Data Tables
Learners review the Cartesian plane and the process of plotting points. In groups, students create tables, identify the slope and y-intercept, and graph the equation. Afterward, learners perform the same process, only, individually. As a...
Curated OER
Match The Graph Circles
High Schoolers engage in a study of circles and graphs that are related with the focus upon finding the center and radius. The lesson includes the suggestion of giving homework using circle problems before this one to create background...


