Curated OER
Probability
Students complete various activities for probability. In this probability instructional activity, students use coins, cubes, peanut butter and jelly, playing cards, number cubes, darts, and a Gauss Curve to study probability. Students...
Curated OER
Ocean Botttom Profile
Students interpret a graph of ocean depths and topographic features. This task assesses students' abilities to interpret figures, organize and represent data, apply knowledge of scale to a profile, and apply theoretical knowledge.
Curated OER
Relations
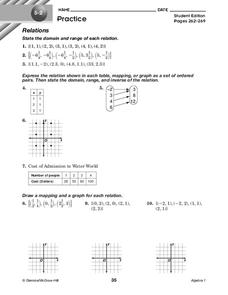
In this relations worksheet, 10th graders solve and complete 10 different problems that include defining various forms of relations. First, they state the domain and range of each relation. Then, students express the relation shown in...
Curated OER
Weather Report Chart
Students complete a weather report chart after studying weather patterns for a period of time. In this weather report lesson, students measure temperature, precipitation, cloud cover, wind speed, and wind direction for a month. Students...
Curated OER
Algebra—Quadratic Equations and Functions
Students use given information on wind speed with the quadratic formula to determine the pressure of the wind on a building. In this quadratic equations lesson, students compute the pressure of the wind from two data tables. They graph...
Curated OER
Peat Pots
Students place a peat pot in water to observe and calculate the rate of capillarity in a model of a soil. This task assesses students' abilities to make simple observations, collect, record, and represent data, use a data table to...
Curated OER
Solving Linear Inequalities
In this linear inequalities worksheet, 10th graders solve 10 different problems that include various forms of linear inequalities. First, they determine the relationship of the numbers. Then, students multiply or divide to get like terms...
Curated OER
Breathing Rates and Exercise
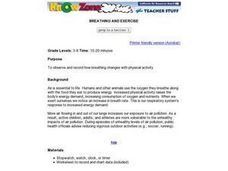
Students work in groups to predict which condition produces more breaths per minute. Groups record their breathing rates during rest periods and periods of activity. They graph their results and make comparisons to their predictions.
Curated OER
Creating a Spreadsheet
Students create a spreadsheet using ICT. In this algebra lesson, students collect and graph their data using a spreadsheet. They find solution to a given problem using trial and error.
Curated OER
Quadratic Relation and Parabola
Students identify the vertex and intercepts of a parabola. In this algebra activity, students graph parabolas and factor quadratic equations. They perform transformation on the parabolas.
Curated OER
Graphing Linear Equations
Ninth graders develop an understanding of and the applications for linear equations and their graphical displays. They participate in a cooperative learning activity of matching a graphic display with an equation.
Curated OER
Quadratics: vertex form
Students practice graphing quadratic equations to find the vertex of quadratic functions. They determine if the graph opens upward or downward as well as convert quadratic equations to vertex form from polynomial form. A lab version is...
Curated OER
Quadratics: Vertex Form
Young scholars practice graphing quadratic equations. They work to solve and equation involving finding the vertex using given formulas. Once their points have been graphed, students determine the direction in which the angle opens....
Curated OER
Using Current Data for Graphing Skills
Students graph demographic information. In this graphing lesson plan, students choose what type of graph to create and what information to display. Links to examples of graphs and statistical data are provided. The graphs are created on...
Curated OER
Forest Activity: Interpreting a Graph
Pupils research forest growth online. They analyze the parts and contents of a graph, then summarize in narrative form the changes in the forest over time.
Curated OER
The Guise of a Graph Gumshoe
Eighth graders practice constructing bar, circle, and box-and-whisker graphs. They practice reading and interpreting data displays and explore how different displays of data can lead to different interpretations.
Curated OER
Sunspot Graphing
Students, using 15 years of sunspot data, plot data on a classroom graph. They discuss why the pattern from their individual sheets did not and could not match the class graph.
Curated OER
Cloud Observation and Graphing
Students identify the three major cloud groups. They are introduced to the three main cloud types and spend a week making and recording observations of clouds. Students produce a graph that presents their findings and conduct research...
Curated OER
Worksheet 1, Coordinate Graphing
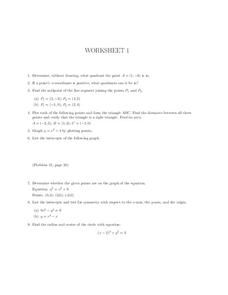
In this algebra worksheet, students determine the quadrant a given point is in. They find the midpoints of two line segments. Students plot points to form a triangle and find the distance between points. Students find the area of the...
Curated OER
Graphing With Second Graders
Second graders sort M & M's and then enter the data into a spreadsheet in order to create a simple graph. After printing the spreadsheet generated graph, have students compare the printed graph with their paper graph.
Curated OER
Graph Your Foot!
Students measure their own foot and place the outline on a graph. They make connections between the size of their foot and the bar graph that represents it.
Curated OER
Graphing
Fifth graders create graphs based on climate in South Carolina. They read and interpret information in a chart and construct a graphy from the information in the chart. They create a spreadsheet using Excel and publish 2 graphs.
Curated OER
Water Pollution Graphing Activity
Students describe and identify the link between land use activities within a watershed and water quality. They evaluate the quality of a "water sample" ( a bag of skittles), graph their results, and form a hypothesis about the land use...
Curated OER
Graphing Your Motion-Day 1
Ninth graders explore the concepts of motion, velocity and acceleration through graphing their own movement using LoggerPro. They become more familiar with the computer technology. Students explore graphing in real time and graph on...


