Mathed Up!
Drawing Quadratic Graphs
Curve through the points. The resource, created as a review for the General Certificate of Secondary Education Math test, gives scholars the opportunity to refresh their quadratic graphing skills. Pupils fill out function tables to...
Mathed Up!
Straight Line Graphs
Develop graphs by following the pattern. The resource provides opportunities for reviewing graphing linear equations. Pupils create tables to graph linear equations by using patterns whenever possible. The instructional activity and...
Illustrative Mathematics
Function Rules
Function machines are a great way to introduce the topic of functions to your class. Here, you will explore the input and output to functions both using numerical and non-numerical data. Learners are encouraged to play with different...
Concord Consortium
Betweenness II
Read between the curves ... quadratic curves! Young scholars analyze the graphs of two quadratic functions by writing their own function whose outputs are between the two given. They then consider intersecting quadratic functions and...
California Education Partners
T Shirts
Which deal is best? Learners determine which of two companies has the best deal for a particular number of shirts. They begin by creating a table and equations containing each company's pricing structure....
Charleston School District
Review Unit 3: Functions
Time to show what you know about functions! The review concludes a series of nine lessons on the basics of functions. The problems included are modeled from the previous lessons. Pupils determine if a table represents a function,...
Illustrative Mathematics
US Garbage, Version 1
An interesting example of a discrete function and how it is applies to the real world. This could easily make a good collaborative instructional activity with an environmental science class. Practice reading a table and drawing a scatter...
Charleston School District
Pre-Test Unit 3: Functions
How does an input affect an output? Assess your learners' ability to answer this question using this pre-test. Scholars answer questions about the basics of a function. Topics include determining if a table or statement represents a...
Illustrative Mathematics
Invertible or Not?
What determines whether a function has an inverse? Learners investigate that criteria when they examine values in a partially completed input-output table for two different functions. The task is to complete the table so that one of the...
Inside Mathematics
Sorting Functions
Graph A goes with equation C, but table B. The short assessment task requires class members to match graphs with their corresponding tables, equations, and verbalized rules. Pupils then provide explanations on the process they used to...
EngageNY
End-of-Module Assessment Task: Grade 8 Module 5
Give your class a chance to show how much they've learned in the module with an end-of-module assessment task that covers all topics from the module including linear and non-linear functions and volumes of cones, cylinders, and...
Noyce Foundation
Toy Trains
Scholars identify and continue the numerical pattern for the number of wheels on a train. Using the established pattern and its inverse, they determine whether a number of wheels is possible. Pupils finish...
Illustrative Mathematics
The Parking Lot
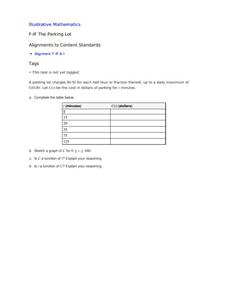
Use the real-world cost of parking a car to demonstrate the properties of a function. The resource describes to learners how much it is to park in a certain lot. It is up to your number crunchers to complete a table of minutes...
Illustrative Mathematics
Invertible or Not?
Two for one—create an invertible and non-invertible function from the same data. The task presents a function table with missing outputs for the class to use to create two functions. One of the functions should have an inverse while the...
Curated OER
A Sum of Functions
Collaborative learners will see the geometric addition of functions by graphing the sum of two graphed curves on the same coordinate plane. This task then naturally flows into giving learners the algebraic representation of the curves...
Inside Mathematics
Functions
A function is like a machine that has an input and an output. Challenge scholars to look at the eight given points and determine the two functions that would fit four of the points each — one is linear and the other non-linear. The...
Inside Mathematics
Quadratic (2009)
Functions require an input in order to get an output, which explains why the answer always has at least two parts. After only three multi-part questions, the teacher can analyze pupils' strengths and weaknesses when it comes to...
EngageNY
Analyzing a Data Set
Through discussions and journaling, classmates determine methods to associate types of functions with data presented in a table. Small groups then work with examples and exercises to refine their methods and find functions that work...
Inside Mathematics
House Prices
Mortgages, payments, and wages correlate with each other. The short assessment presents scatter plots for young mathematicians to interpret. Class members interpret the scatter plots of price versus payment and wage versus payment for...
West Contra Costa Unified School District
Point-Slope Application Problems
Create a linear equation for a problem when the intercept information is not given. The two-day lesson introduces the class to the point-slope form, which can be used for problems when the initial conditions are not provided. Pupils...
Khan Academy
Khan Academy: Algebra I: Exponential Functions From Tables & Graphs
Write exponential functions of the basic form f(x)=a * b squared, either when given a table with two input-output pairs, or when given the graph of the function. Students receive immediate feedback and have the opportunity to try...
Khan Academy
Khan Academy: Recognize Functions From Tables
Determine whether a table of values of a relationship represents a function. Students receive immediate feedback and have the opportunity to try questions repeatedly, watch a video or receive hints.


