University of North Texas
Library of Functions
Join the family picnic and see how all the functions come together in a PowerPoint that highlights their main features. As it includes topics such as domain, range, and intercepts, the slides are a great guide to promote class...
Howard County Schools
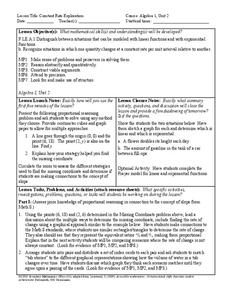
Constant Rate Exploration
Question: What do rectangles and bathtub volume have in common? Answer: Linear equations. Learn how to identify situations that have constant rates by examining two different situations, one proportional and one not proportional.
Mathematics Assessment Project
Representing Inequalities Graphically
A new, improved version of the game Battleship? Learners graph linear inequalities on the coordinate plane, then participate in a game where they have to guess coordinate points based on the solution to a system of linear...
EngageNY
Modeling Relationships with a Line
What linear equation will fit this data, and how close is it? Through discussion and partner work, young mathematicians learn the procedure to determine a regression line in order to make predictions from the data.
EngageNY
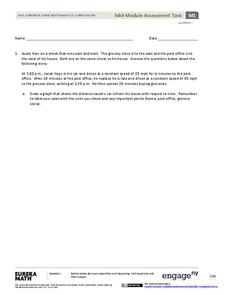
Mid-Module Assessment Task - Algebra 1 (module 1)
Looking for performance tasks to incorporate into your units? With its flexibility, this resource is sure to fit your teaching needs. Use this module as a complete assessment of graphing linear scenarios and polynomial operations, or...
PBL Pathways
Boogie Boards
Solve a complex business puzzle by building a linear programming model. An engaging project-based learning problem has classes examining transportation costs and manufacturing limitations from several plants. Ultimately, they use their...
CK-12 Foundation
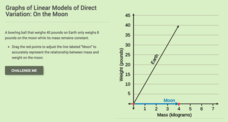
Graphs of Linear Model of Direct Variation: On the Moon
You'll be over the moon about this resource. Scholars draw a line representing the weight of an object on the moon based on its mass. Consideration of the constant of proportionality allows them to see relationships between weight of an...
CK-12 Foundation
Graphs Using Slope-Intercept Form: Mountain
Climb every mountain, even one you create in an interactive. Individuals solve a problem involving slopes and distances of campsites on a mountain. Answering a set of challenge questions aids in the process.
Curated OER
Real-World Linear Equations
Eighth graders practice technology skills through the use of a spreadsheet and a discovery lesson plan focusing upon linear equations. The technology allows for the visual changes to be displayed for different lines of equations.
Curated OER
Solving Linear Inequalities
In this linear inequalities worksheet, 10th graders solve 10 different problems that include various forms of linear inequalities. First, they determine the relationship of the numbers. Then, students multiply or divide to get like terms...
Curated OER
Addition to Solve System of Linear Equations
In this algebra worksheet, students solve system systems of equation. They use addition to solve the problems. There are 6 questions with an answer key.
Curated OER
The King's Chessboard
Middle schoolers speculate on the better rate of pay: a dollar a day for 10 days, or a penny the first day, two pennies the second, doubling each day for 10 days. Start by listening to the story The King's Chessboard, by David Birch....
Illustrative Mathematics
Delivering the Mail
A mail truck travels the same amount of miles per day. It will be up to your algebra learners to find an equation for this mailman’s truck. One needs a good understanding of rate of change and the initial value for this model. The...
Curated OER
Introducing y = mx + b
Middle and high schoolers use the slope intercept form to graph a line. In this algebra lesson, pupils rewrite equations from standard form to y-intercept form. They use the slope and y-intercept to graph a line without making a table of...
Curated OER
Slope Intercept Form
In this slope intercept form worksheet, students solve and graph 6 different problems that include identifying the slope and intercepts in each graph. First, they determine the line that has a given x-and y-intercept. Then, students find...
Curated OER
Parent Functions Review Sheet
No laundry or cooking dinner here: these parent functions are all about math. Every graph you could think of from basic linear functions to the hyperbolic arccotangent function are included. With 40 parent functions, the worksheet...
Curated OER
Introducing Linear Terminology
Ninth graders graph linear equations and inequalities in two variables and then, they write equations of lines and find and use the slope and y-intercept
of lines. They use linear equations to model real data and define to define the...
Curated OER
Exploring Equations and Y-Intercept
Students graph linear equations using intercepts, find y-intercept, find x-intercepts and graph linear equations that use horizontal and vertical lines.
Curated OER
Generating Points and Graphing
Students create a table of values to help them plot. In this algebra activity, students plot their points on a coordinate plane creating a graph. They observe and analyze linear functions.
Curated OER
2 X 2 Linear Systems
Students solve 2 X 2 systems graphically and algebraically. They investigate parallel systems. They solve application problems using 2 X 2 systems.
Curated OER
Coordinates and Equations
In this algebra worksheet, students solve linear equations and plot their results on the coordinate plane. There are 20 problems using slopes and intercepts to help graph linear equations.
Curated OER
Graphing Functions
In this graphing functions worksheet, 10th graders solve 10 different problems that illustrate various graphs of functions. They determine the type of function that each graph shows. Then, students write the equation for the line graphed...
Curated OER
Graphs
In this graphs worksheet, 10th graders identify and solve 10 different problems that include reading various graphs of lines. They determine the equation for each graph whether it is dealing with tangent, cotangent, secant or cosecant.
Curated OER
Tube Viewer Simulation
Students graph linear equations. In this algebra lesson plan, students discuss the effect the change in one variable has in an equation. They discuss the effect equations have if you chage the value of the variable.
Other popular searches
- Graphing Linear Systems
- Algebra Graphing Lines
- Graphing Lines Quilt Pattern
- Linear Equations and Graphing
- Linear Equations Graphing
- Pre Algebra Graphing Lines
- Area Graphing Lines
- Ged Graphing Lines
