Curated OER
Study Buddies - Bar Graphs
In this data collection worksheet, young scholars work with a partner to make 3 small bar graphs after finding the proper number of circles on the first page. They look at a page of a variety of shapes and separate the circles into...
Curated OER
Pictures of Data: Post Test
In this data learning exercise, students answer multiple choice questions about charts and graphs. Students answer 10 questions total.
Curated OER
Activity: Make a Bar Graph
In this bar graph activity, students use a given picture to create a graph, then use the graph to solve 2 related problems. Graph is sports related.
Curated OER
Introduction to Graphs: Bar Graphs, Line Graphs, Circle Graphs
For this graphing data worksheet, middle schoolers answer 5 short answer questions about graphs. Students determine which type of graph best represents various data sets.
Curated OER
Graph Made Easy: Post Test
In this graphs worksheet, students answer multiple choice questions about line graphs and bar graphs. Students answer 10 questions total.
Curated OER
Bar Graphs and Histograms
For this bar graphs and histograms worksheet, students create bar graphs and histograms from given information. They interpret graphs. This one-page worksheet contains 6 multi-step problems.
Curated OER
Picture This
In this shapes worksheet, 2nd graders look at 9 lettered pictures within a grid and copy each shape in the correct lettered box in the second grid. Students write down what they see in a complete sentence.
Curated OER
Generate Measurement Data Word Problems
Bar and line graphs are an excellent way to visually analyze data: give your scholars practice both analyzing graphs and creating their own! First, they examine five basic bar graphs, indicating the number of squares on specific days....
Curated OER
7th Grade Math Worksheet
For this integers worksheet, 7th graders solve 10 different problems that include various types of integers and graphs. First, they determine the sum of 3 consecutive integers. Then, students find the ratio between 2 areas of similar...
Willow Tree
Histograms and Venn Diagrams
There are many different options for graphing data, which can be overwhelming even for experienced mathematcians. This time, the focus is on histograms and Venn diagrams that highlight the frequency of a range of data and overlap of...
Curated OER
Graph Groups
For this graphing worksheet, 3rd graders create their own bar graphs. students study the pictures shown and complete 5 graphs beside each picture.
Curated OER
Who's Hiding in Mike's Math Club Picture?
Learners use coordinates to complete the picture. They complete seven groups of coordinates and connect the dots to create an image.
Wise Owl Factory
Happy Father's Day
Celebrate Father's Day this year with a fun math and coloring activity! After counting all of the dad-related pictures and graphing their frequency, learners color a Father's Day card to give to their dads.
Mathed Up!
Pictograms
Young mathematicians read, interpret, and complete a variety of real-world pictograms. Each question includes a key and information to complete the graphs.
Curated OER
Bear Graphing 1-5
In this math worksheet, students arrange 5 bears in a picture of a heart. Students graph how many bears have their hands up and how many have their hands down.
Curated OER
Food for Class Party
In this interpreting a bar graph and math word problems worksheet, 2nd graders read the information about choices of food for a class party and answer various multiple choice questions. Students solve 25 problems.
Curated OER
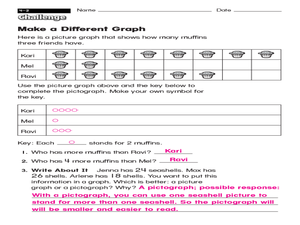
Make a Different Graph
What is the difference between a picture graph and a pictograph? Young learners are given a picture graph detailing how many muffins three friends have, and they must complete a pictograph using a symbol of their choice. An answer key is...
Curated OER
Recognizing Bias in Graphs
In this bias in graphs worksheet, students examine graphs and explain the data. They determine why the graph is or is not biased. This four-page worksheet contains approximately 6 problems. Explanations and examples are provided.
Curated OER
Smarties Pictogram and Bar Chart
For this math worksheet, students create a bar chart to illustrate the number of Smarties they have in each color. Students also draw a pictogram to represent the same information.
Curated OER
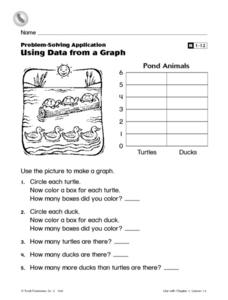
Using Data From a Graph
In this graphing worksheet, students create a bar graph with information from a picture of some pond animals. Students answer 5 questions about the graph.
Curated OER
Sort and Graph Coins
In this sorting and graphing practice learning exercise, students cut out the coin pictures, glue 1 in each of 4 columns, and color in the graph with the correct number of each of the coins shown.
Curated OER
Graphing Ordered Pairs
In this graphing instructional activity, students graph ordered pairs on a coordinate plane. They connect each plot to create a picture. This one-page instructional activity contains 28 problems.
Curated OER
Pictures for Short Roleplays in Random Business Situations
In this role plays worksheet, students look at pictures of people and answer the short answer questions below them. Students explain 9 pictures.
Curated OER
THE EASTER BUNNY GETS READY! PICTURE GRAPH
In this graphing worksheet, students read a picture graph about colors of Easter eggs and then answer questions about the graph.
Other popular searches
- Coordinate Graphing Pictures
- Cartesian Graphing Pictures
- Christmas Graphing Pictures
- Coordinates Graphing Picture
- Picture Graphing
- Graphing Picture With Ti 83
- Graphing Picture Fall
- Coordinate Picture Graphing
- Graphing Picture Squares
- Graphing Picture Autumn
- Picture Graphing Puzzles
- Graphing Picture Worksheets


