Texas Instruments
TI-Nspire™
We landed on the moon with less computing capabilities than you can find in this app! Here is a multiple function calculator that takes all the power you get from a handheld and adds the wonderful large screen that only a tablet can...
Texas Instruments
TI-Nspire™ CAS
When it comes to rating educational calculators, this calculator is always near the top of this list. Now it's available as an app. There is a lot of calculator power wrapped up in this app. Not only is this a fully functioning...
Houston Area Calculus Teachers
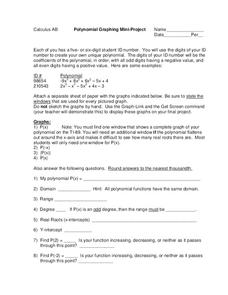
Polynomial Graphing
Your AP Calculus learners probably have their ID numbers memorized, but have they tried graphing them? Pique your pupils' interest by asking each to create a unique polynomial function based on their ID numbers, and then analyze the...
Texas Instruments
Exploring Basic Equations
Learners explore equations with constants, variables and with exponents. They identify and define variables, constants, exponents, expressions, and equations, as well as give an example of each. Your class will also draw their...
Curated OER
Match The Graph Circles
High Schoolers engage in a study of circles and graphs that are related with the focus upon finding the center and radius. The instructional activity includes the suggestion of giving homework using circle problems before this one to...
Texas Instruments
Let's Play Ball with Families of Graphs
Learners explore quadratic equations in this Algebra II instructional activity. They investigate families of quadratic functions by graphing the parent function and family members on the same graph. Additionally, they write the equation...
Curated OER
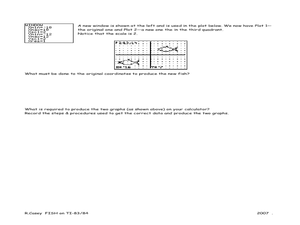
Fishing for Points TI-83/83 Plus
Ninth graders investigate the Cartesian coordinate plane. In this Algebra I instructional activity, 9th graders explore the coordinates of a drawing of a fish and examine the effects of moving the drawing on the ordered pairs. Students...
Curated OER
What's My Ratio?
Students investigate ratios of various objects. In this ratios of various objects lesson plan, students draw pictures on graph paper and then dilate or shrink the image. Students determine the ratio of their pictures. Students trade...
Curated OER
A Steep Hike
Students explore slope. In this middle school mathematics lesson, students analyze and interpret graphs as they investigate slope as a rate of change. Students use a motion detector to collect data as they walk at different speeds and...
Curated OER
Seeing is Believing: Derivatives
Learn to solve functions by taking the derivatives. In this calculus lesson, young scholars compare the graph of a derivative to that of the original function.
Curated OER
Transforming Snoopy Using Coordinates
Middle schoolers graph coordinate points to create a picture of Snoopy. In this coordinate point lesson plan, students read a book and learn about Rene Descartes' invention, the coordinate grid. Middle schoolers graph a surprise picture...
Curated OER
River Optimization Problem
Young scholars define the different methods used for optimizing a particular element of a problem. In this optimization problem lesson, students optimize appropriate details of a problem using data collection, algebra, technology, and/or...
Curated OER
The Foods we Eat (Los Alimentos)
Sixth graders sing a song and create flashcards showing their favorite foods. In this Spanish "What do you like? lesson, 6th graders display Spanish foods using a document camera and graph their favorites.
Charleston School District
Analyzing Scatter Plots
Scatter plots tell a story about the data — you just need to be able to read it! Building from the previous lesson in the series where learners created scatter plots, they now learn how to find associations in those scatter plots. They...
Curated OER
Analyzing Country Data
Young scholars analyze different data in percentage form. In this statistics lesson, students plot data using box-plots, dotplot, and histogram. They compare and contrast the collected data using the boxplot.
Curated OER
Modeling With Circular Functions
High schoolers explore circular functions. They identify the amplitude, period, phase shift and vertical shift of circular functions. Students analyze phenomena described by sine waves and they find mathematical models for transforming...
Curated OER
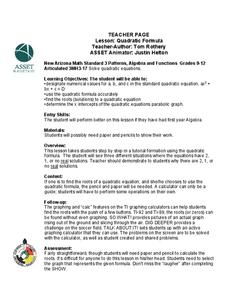
Quadratic Formula
Students factor and solve quadratic equations.In this algebra lesson, students identify the roots of an equation using the quadratic formula. They graph and identify the properties of a parabola.
Curated OER
Cause and effect Relationship
Young scholars examine folk’s tales for Cause and Effect. In this literature lesson, students read "The Origin of Fire" and "The Origin of Medicine” and look for cause and effect. They use a TI Navigator to write down their findings.
Curated OER
"Ball Bounce" Quadratic Functions
Young scholars manipulate a ball and explore quadratic functions. In this algebra lesson, students analyze the graph of a quadratic function. They identify quadratic properties.
Curated OER
Investigating Motion
Students determine velocity using the slope of a time distance graph. They investigate a motion cart using a CBR unit and a TI 83 calculator setup. Using the graph generated, they calculate velocity.
Curated OER
Skate Party
Learners use the Frayer model during problem solving. In this problem solving lesson, they examine multiple methods of data collection to solve real world problems. Resources are provided.


