California Education Partners
Linflower Seeds
How does your garden grow? Use proportions to help Tim answer that question. By using their understanding of proportional relationships, pupils determine the number of seeds that will sprout. They create their own linear...
California Education Partners
Animals of Rhomaar
Investigate the growth rates of alien animals. Pupils study fictional animals from another planet to determine how much they grow per year. The investigators plot the growth of their animals over a period of time and then compare...
Mathed Up!
Frequency Polygons
Frequency polygons are a different way to represent frequencies over intervals. Pupils take frequencies for intervals of data from a frequency table and plot them as a frequency polygon. Budding mathematicians find information about the...
Mathed Up!
Pie Charts
Representing data is as easy as pie. Class members construct pie charts given a frequency table. Individuals then determine the size of the angles needed for each sector and interpret the size of sectors within the context of frequency....
Curated OER
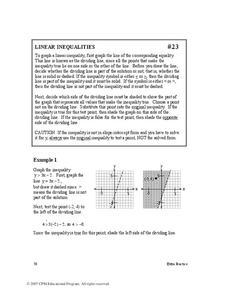
Linear Inequalities
In this linear inequalities worksheet, learners solve and graph systems of inequalities on a coordinate plane. Examples and explanations are provided. This five-page worksheet contains 32 problems. Answers are provided at the end of...
Curated OER
Which Car Should I Buy?
Students use gas mileage of different cars to create T charts, algebraic equations, and graphs to show which gets better mileage. In this gas mileage lesson plan, students use the graph to see which car they should buy.
Curated OER
Too Much Oxygen or Too Little?
In this oxygen instructional activity, students analyze date about the oxygen levels in a river to determine the cause of the dying fish. This instructional activity has 2 graphs, 12 short answer questions, and 2 graphic organizers.
Curated OER
Coordinates
In this coordinates worksheet, students analyze two maps and identify the coordinates of ten specific locations. Students plot sixteen points on a graph and check their answers online at the end of each exercise.
Curated OER
Hassan's Pictures - Linear Programming and Profit Lines
Students graph systems of linear inequalities. In this linear programming and profit lesson plan, students explore linear programming problems. They graph a feasible region in a linear programming problem and identify the profit lines....
Curated OER
Domain and Range 2
How do you identify the domain and range of the function? As learners find out it's as easy as creating a graph. They'll identify the domain and range of a relation from its graph, write symbolic expressions describing the relationship...
Curated OER
Comparing Costs
Learners compare the costs of two cellular phone plans and determine the best rate. They use a table and a graph of points plotted on a Cartesian plane to display their findings. Students write an equation containing variables that could...
Curated OER
Slope-Intercept Form of a Line
High schoolers determine how the slope affects the graph of a line. They relate "b" to the "y"-intercept of a line and solve the equation of a line given "m" and "b." They are given scenarios and possible answers to which they explain...
Curated OER
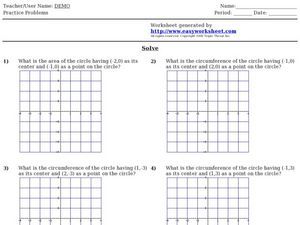
Easy Worksheet: Area and Circumference of Circles
In this area and circumference of circles worksheet, high schoolers solve 4 graphing problems. Students graph a circle given an endpoint and center. High schoolers find the area or circumference of the circle they graphed.
Curated OER
Slope Exploration
In this slope exploration worksheet, 9th graders solve and complete 18 different problems that include graphing and investigating the slope of various equations. First, they graph each pair of points and draw a line that contains both...
Curated OER
Curve Sketching
In this calculus worksheet, students sketch a curve using a given function. They take the derivative of a function and graph it. There are 10 questions.
Curated OER
Make a Pass at Me
Students identify different types of functions and units of measurements. In this statistics lesson, students will collect data, graph their data and make predictions about their data. They plot a linear regression graph.
Curated OER
Introduction to Differentiation
In this introduction to differentiation worksheet, students solve and complete 10 various types of problems. First, they use the definition of differentiation to evaluate the derivative of the functions listed. Then, students sketch the...
Curated OER
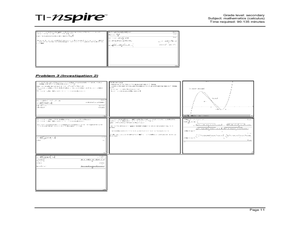
Two Investigations of Cubic Functions
Through learning about cubic functions, high schoolers graph cubic functions on their calculator. Students determine the local maximum and minimum points and the tangent line from the x-intercept to a point on the cubic...
Curated OER
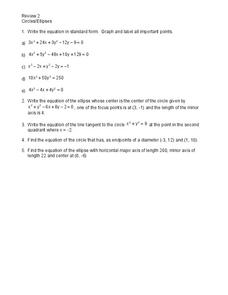
Circles and Ellipses
In this circles and ellipses worksheet, students solve and complete 5 different types of problems. First, they write each equation in standard form. Then, students graph and label Write the equation of the ellipse whose center is the...
Curated OER
Inequalities and Measures of Central Tendency
In this inequality and measures of central tendency worksheet, students solve and graph linear inequalities. They organize given data to identify the mean, mode and range. Students interpret box-and-whisker plots. This three-page...
Curated OER
The Apple Orchard Problem
Students explore various approaches to solving a problem of maximizing the total production of apples in an orchard. In this apple orchard lesson, students collect data in order to solve the apple orchard problem presented. Students plot...
Creative Chemistry
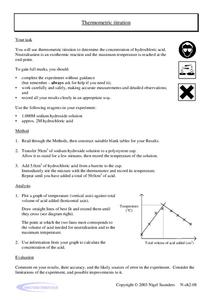
Thermometric Titration
In this thermometric titration learning exercise, students titrate hydrochloric acid with sodium hydroxide to determine its concentration. They measured the solution's change in temperature, plotted their data, and used the graph to find...
Curated OER
Equations of Circles
For this equations of circles worksheet, 10th graders solve 10 different problems that include graphing different circles. First, they convert the equations into center-radius form given the coordinates of the center of the circle and...
Curated OER
Slope & Intercepts
In this slope and intercepts worksheet, 9th graders solve and graph 6 different problems that include responding to questions in reference to each equation. First, they complete the table and graph by solving each equation. Then,...
Other popular searches
- Graphing Points Picture
- Graphing Points Activity
- Art From Graphing Points
- Graphing Points on a Grid
- Halloween Graphing Points


