Curated OER
Inequalities Compound Fram
Students practice graphing compound inequalities. They draw a Venn Diagram on two different sports visualizing that their is a middle section on commonality among the two sports groups and then relate that concept to compound inequalities.
Curated OER
A Plop and Fizz
Seventh graders perform an experiment to determine the effect of temperature on reaction rates. In this chemistry lesson, 7th graders take measurements and record data. They create a graph and analyze results.
Curated OER
Derivative Grapher
Learners graph the derivative of functions in this calculus lesson plan. They use the TI to graph their functions and algebraically take the derivative of each function. They then create a visual and analyze the graph.
Curated OER
Three In a Row
Sixth graders examine how to locate coordinate points. In this coordinate graphing lesson, 6th graders locate the x and y axis. Students use their arms to show horizontal and vertical lines, participate in group and...
Curated OER
Simple Inequalities on a Number Line
Young scholars solve inequalities problems. In this algebra lesson, students graph the solution of inequalities on a number line. They discuss boundaries and open or closed intervals.
Curated OER
Domain and Range of Exponential Functions
Have your class find the domain and range for each function. Students graph equations using the TI. They find all the x and y values as they relate to the domain and range.
Curated OER
Writing Linear Equations
In this linear equations learning exercise, 9th graders solve and complete 15 different problems that include writing each in slope-intercept form. First, they state the slope, x-and y-intercepts, and write an equation in slope-intercept...
Curated OER
Literacy Activity: The Perfect Pet
Students develop their listening skills as they listen to the book The Perfect Pet. In this reading lesson, students listen to the book, and then talk about the pets they have. Then they make a graph as a class of all their pets.
Curated OER
Solving Quadratic Equations
In this Algebra I/Algebra II worksheet, students solve quadratic equations by graphing and by taking the square root of both sides. The two page worksheet contains a combination five multiple choice and free response...
Curated OER
The Order of Things on a Coordinate Grid
Students are able to identify ordered pairs on coordinate plane, and graph points on a coordinate plane. They are able to write an ordered pair for each of the points on a graph, and create a design or picture using ordered pairs.
Curated OER
Slope
In this slope worksheet, 9th graders solve and complete 18 different problems that include identifying various points on a graph. First, they determine the slope of each line drawn on the grid to the right. Then, students determine the...
Curated OER
Algebra II Test
In this algebra test, students must determine 3 definitions, match 4 equations to the answer, 4 short answer, and graph 4 points on a coordinate plane. There are 20 questions total.
Curated OER
Maximum and Minimum of Functions
For this calculus worksheet, students are given functions and values to derive using the functions. They are asked to find the maximum, minimum and point of inflection. There are 28 questions.
Curated OER
Coordinate Geometry
In this geometry activity, students solve and graph points on coordinate plane. They write the equation of a line and describe the line's position on a coordinate plane. There are 9 questions with an answer key.
Curated OER
Mathematical Analysis of Temperature Scales
Students use the point-slope formula to determine the relationship between the Celsius and Fahrenheit scales of temperature. They use a graphing calculator to determine the slope of the line between two points in each scale.
Curated OER
Read, Recognize & Graph Integers
Students explore negative and positive integers on a number line. They review a newspaper to determine careers that use positive and negative integers. In groups, they read and answer questions on "Lifestyles of the Rich and...
Curated OER
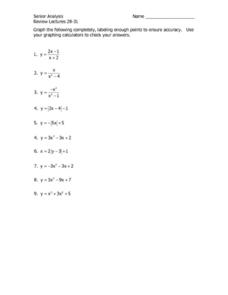
Senior Analysis: Graphing
In this graphing worksheet, students graph given equations. They identify points on the line. This one-page worksheet contains nine problems.
Curated OER
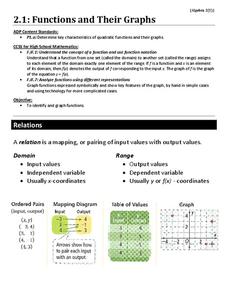
Functions and Their Graphs
Use a worksheet to go over the basic concepts of relations and functions. Included are clear definitions and examples of relations, domain and range, and functions and the vertical line test. However, the problems are pretty...
Illustrative Mathematics
Graphs of Compositions
It might help when working with this resource to give an example of a composition function. For example, the amount of time it takes to get to work depends on the amount of traffic; the amount traffic depends on the time of day....
School Mathematics Project
Resource Sheets
This extensive and far-reaching collection of worksheets puts a new twist on many basic concepts. Learners use multiplication to trace a path from one point to another, tile a plane by converting between improper and proper fractions,...
Modesto Junior College
Graphical Transformations of Functions
Transform your knowledge from average to excellent with this comprehensive guide to function transformations. All of the types of shifts, stretches, and reflections are included with an explanation and coordinating graph to show...
Sri Atmananda Memorial School
Rising Water
An engaging, and not to mention attractive, lesson plan has prealgebra and beginning algebra scholars examining linear relationships. They consider the rising water level as a swimming pool is being filled. They do so by charting and...
Curated OER
Linear and Exponential Functions
This comprehensive unit on linear and exponential functions provides numerous clearly-written worksheets. Topics include graphing linear equations, solving systems of equations algebraically and by graphing, identifying the domain and...
Curated OER
A Solubility Curve for Potassium Nitrate
Step-by-step laboratory instructions are listed so that chemistry explorers can consider the solubility of potassium nitrate. They combined their results with other lab groups' results and then graphed the data to display the solubility...
Other popular searches
- Graphing Points Picture
- Graphing Points Activity
- Art From Graphing Points
- Graphing Points on a Grid
- Halloween Graphing Points
