Charleston School District
The Distance Between Points
Find the shortest distance from A to B using the Pythagorean Theorem! Scholars learn they can find the distance between two points by creating a right triangle using the horizontal and vertical lengths and applying the Pythagorean...
Curated OER
Exploring Graphs
Students are introduced to connecting graphing in a coordinate plane to making scatterplots on a graphing calculator. Working in pairs, they connect points plotted to make a sailboat and complete questions on a worksheet as well as plot...
Curated OER
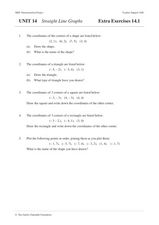
Straight Line Graphs
In this algebra learning exercise, students graph coordinate pairs on a coordinate plane. They match points with letters and graph a line through all the plotting to create a straight line. There are 25 questions with an answer key.
Curated OER
Graphs of Parabolas
In this graphs of parabolas activity, 10th graders solve 10 different problems that include the graphs of various parabolas. First, they graph the parabola given the equation to determine which way the parabola opens. Then, students...
Curated OER
Graphs
In this graphing worksheet, 9th graders read one page of graphing examples and complete 8 exercise problems. Each problem involves graphing and coordinates.
Curated OER
Plot Points in the Coordinate Plane
In this basic worksheet on plotting coordinate points, student practice how to describe where an ordered pair is located on a graph.This activity can provide a short review of material covered in class.
Curated OER
Graphing and Analyzing
For this graphing and analyzing worksheet, 9th graders first state if each graph represents a linear or nonlinear relationship. Second, they create a difference table for each set of data presented and determine whether it represents a...
Raytheon
Equations and Graphing Review
In this equations and graphing review instructional activity, learners write, graph and solve equations for 62 problems, including a mid-unit review, with answers included.
Curated OER
Math A Regents Questions: Points on a Line
In this linear equations worksheet, students solve 3 multiple choice problems. Students determine if a given point lies on a line given an equation of that line.
Curated OER
Graph Ordered Pairs of Integers
This instructional activity is basic, but provides a variety of ways for students to practice identifying points on a coordinate graph. Students start by identifying points in various quadrants, and end up naming ordered pairs.
Curated OER
Interpreting Line Graphs
Fifth graders interpret line graphs. In this graphing instructional activity, 5th graders first begin by reviewing the difference in bar and line graphs and what they are used for. Students practice interpreting the data on various line...
Curated OER
Olympic Bar Graphs
In this Olympic bar graph worksheet, young scholars pick a sport from the 2004 Olympic games and find data from the Olympic web page. They graph the scores (times, distance, or speed) and the medals. They answer questions about the...
Curated OER
Making a Line Graph
In this line graph worksheet, students use data given in a table and assign axes, make a scale, plot data and make a line or curve on their constructed graphs.
Curated OER
Data Analysis, Probability, and Discrete Math: Line Graphs
Eighth graders analyze data from line graphs. They discuss the purpose of line graphs, identify the parts of a line graph, answer questions about various graphs, and complete a worksheet. This lesson includes a script to teach along with.
Curated OER
Basic Algebra and Computers: Spreadsheets, Charts, and Simple Line Graphs
Students, while in the computer lab, assess how to use Microsoft Excel as a "graphing calculator." They view visual representations of line graphs in a Cartesian plane while incorporating basic skills for using Excel productively.
Curated OER
Graphing at all Levels: It's a Beautiful Thing!
Mixing math and art is done in this activity by applying graphing knowledge to create a unique piece of art. This activity varies acording to the graphing knowledge of the artist. First, learners identify and review various types of...
Curated OER
Fast Food Survey Using Bar Graphs
Second graders create a bar graph to pictorically represent the data collected from a survey of students. They use Excel to electronically create the graphs and data tallies. They then interpret their data using sentences to explain.
Curated OER
Spaghetti Graphs
Students work in pairs to test the strength of spaghetti strands. They collect and graph data to determine a line of best fit. Students create a linear equation to interpret their data. Based on the data collected, students predict...
Curated OER
Info. From a Graph
In this graphing instructional activity, high schoolers answer 13 questions about 3 graphs. Students determine the degree, roots, y-intercepts, inflection points, multiplicity, etc. of three different graphs.
Curated OER
Math Regents Exam Questions: Graphing Rational Functions
In this graphing rational functions activity, students answer 18 multiple choice problems about rational functions. Students determine values for a which a function is undefined given the equation of the function.
Utah Education Network (UEN)
Finding Slope of a Line from Graphs, Tables, and Ordered Pairs
Middle schoolers explore the concept of slope in numerous ways and start to look at simple linear equations. They describe the slope in a variety of ways such as the steepness of a line, developing a ratio, using graphs, using similar...
Mt. San Antonio Collage
Test 1: Functions and Their Graphs
Save the time creating an assessment because these function problems should do the trick. With 10 multi-part questions, they each focus on a different topic including radical, polynomial, linear and piecewise functions. The majority of...
Curated OER
Class Birthday Graph
Young scholars analyze the basics of an Excel spreadsheet. They highlight cells in a spreadsheet. They make a column graph. Students are introduced to X-axis and Y-axis. They play various address games on the spreadsheet.
Jude Mphoweh
Coordinates
This coordinate graphing lesson gives your young graphers practice graphing points on these rectangular coordinate grids.
Other popular searches
- Graphing Points Picture
- Graphing Points Activity
- Art From Graphing Points
- Graphing Points on a Grid
- Halloween Graphing Points


