Math Drills
Thanksgiving Cartesian Art: Pilgrim Hat
What did some Pilgrims wear on top of their heads? Individuals graph sets of ordered pairs, and connect the points to create a mystery Thanksgiving picture.
Curated OER
Graphing Names in Historic Cemetery
Students collect information from headstones about names of the deceased in their local community. They determine the most common names and graph them. They discuss their findings with the class.
Yummy Math
A Cardioid for Valentine’s Day
It's Valentine's Day in geometry class! Celebrate the day of love with a heart-themed activity in which young mathematicians create a cardioid on polar graph paper.
Curated OER
Understanding Latitude and Longitude
Teaching learners about latitude and longitude can get a little complicated. Present the concept by first representing it as a graph. Just like finding a location on a graph using the x and y-axis, learners will be able to locate items...
Yummy Math
Parametric Equations and a Heart
Trigonometry, art, and Valentine's Day come together in a creative activity about parametric equations. Learners calculate several equations before graphing them either by hand, on a graphic calculator, or Excel spreadsheet to curve...
Curated OER
The constitution and Our Republic
Young scholars record and interpret data. In this constitution lesson, students discuss voting and making bar graphs. Young scholars practice voting and do a bar graph activity. Students make visual representations of votes on the board.
EngageNY
TASC Transition Curriculum: Workshop 12
How can opinions slant facts? Workshop participants learn how to examine primary and secondary sources and identify the author's point of view. They also examine how visual art impacts the meaning and rhetoric of sources. Full of...
Curated OER
The Frozen Desert: Graphing and Comparing Climates
Students explore the concept of climate. They use temperature and precipitation data from their area and other regions to construct climate graphs. These graphs are used to help identify factors that influence climate.
Curated OER
North Africa
Student examine the unique physical and human characteristics of Russia and the former Soviet Republics, the Middle East and North Africa, and Sub-Saharan Africa. They are able to compare how cultural characteristics affect different...
Curated OER
The Stock Market
Students explore the loss and gain made in the stock market as they invest a sum of money and report the results as percentages instead of points.
Curated OER
Local Traffic Survey
Students conduct a traffic survey and interpret their data and use graphs and charts to display their results.
Curated OER
Civil War Research
Eighth graders research different aspects of the Civil War using various multi-media techniques. Students create a report based on their research that includes views of the war from the point of view of the North, South and slaves.
Curated OER
This is My Neighborhood
Learners predict the things that they may see, smell, or hear in their neighborhood. They take part in a neighborhood walk, creating a rough map of their neighborhood as they go. Upon return to the classroom, students create a final map...
Curated OER
Map Your School
Learners participate in a project to map their school. They measure and graph various areas around the school. Young scholars find the longitude and latitude of the school and research the school's history, and highlight special...
Curated OER
Great Lakes Homepage for Kids
Here are some outstanding lessons on the geology and history of the Great Lakes. These lessons are divided into Grade 4 -6, and Grade 7 - 8 activities. The activities all use the background information, maps, graphs, data, and Great...
Federal Reserve Bank
Barbie in the Labor Force
How have the women's share of the labor force and chosen occupations evolved in the United States over the last century? Using census reports, graphs detailing the gender makeup of the labor force, and analysis of the careers of...
Curated OER
School Sleuths Treasure Map
Students are explained how a grid and compass work. They are also explained that archaeologists use grids as a record of the exact location of artifacts. Students define the term datum as a point of reference on grids from which all...
eGFI
Design a Green Rooftop Garden
Design and construct buildings with rooftop gardens. Junior engineers work in groups to build two buildings and then perform experiments to determine whether or not a garden affects the building's temperatures. They graph and interpret...
Curated OER
Real World Investigation- Math and Geography- Elevation Changes
For this math and geography real world investigation, 6th graders plan a driving trip to a city that is located several states away from their home while recording the elevations of three cities that are included in the trip. They use...
Curated OER
Famous People: Student Worksheet
Older learners consider a list of famous people, and they fill in two columns; one in which they guess the celebrities' ages, and another where they look up their actual age. They construct a graph by assigning one of the columns...
Sharp School
Geography Project
This very simple geography project can lead to a lot of useful referential information that can be displayed in your classroom! Learners construct a poster-size map of a country, identifying major demographic points and including pie/bar...
Curated OER
East Asia Country Project
Get your young historians thinking about East Asian culture and history during this partner research project, in which they analyze a variety of East Asian aspects to prepare for a presentation. After an initial "what do we already know"...
Curated OER
Understanding Weather and Climate Patterns
Learners research the climate patterns of various locations and make predictions based on their findings. They determine the importance of latitude and longitude in weather and climate. Students create graphs displaying their collected...
Curated OER
Cartoons for the Classroom: Interpreting the "Tank Man" Symbol
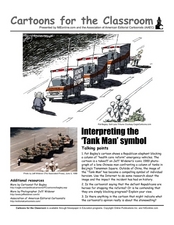
The iconic image of the Tank Man is imitated in this political cartoon analysis, in which learners examine a cartoon depicting a similar standoff. The original image is pictured, and learners compare it to a more modern cartoon of the...
Other popular searches
- Graphing Points Picture
- Graphing Points Activity
- Art From Graphing Points
- Graphing Points on a Grid
- Halloween Graphing Points


