Hi, what do you want to do?
Texas Education Agency
Texas Gateway: Scientific Investigation and Reasoning Data Organization
Using interactive exercises, students will review how to construct tables and graphs in order to organize data.
National Center for Ecological Analysis and Synthesis, University of California Santa Barbara
Kids Do Ecology: Data and Science
Learn about conducting your own investigation with these tips on following the scientific method. Find out how to state hypothesis, make observations, collect and analyze data, and display data to share results and conclusions of your...
American Association of Physics Teachers
Com Padre Digital Library: Open Source Physics: Data Tool Program
Use this online data analysis tool to build graphs and display results from scientific investigations. Data can be entered directly with the keyboard or imported from, and exported to spreadsheets.
University of Illinois
University of Illinois: Data Types
The University of Illinois provides this site that is helpful because of the various kinds of data that can be collected. This lesson plan helps students differentiate between qualitative, quantitative, and many other types of data.
Other
Brebeuf Jesuit Preparatory School: The Scientific Method (Part 3) [Pdf]
Explains how to collect and organize data for an experiment. Describes how to make a table and graph the data, and when to use different types of graphs. Next, it discusses which variable should be on the x- or y-axis of a graph, and how...
Sophia Learning
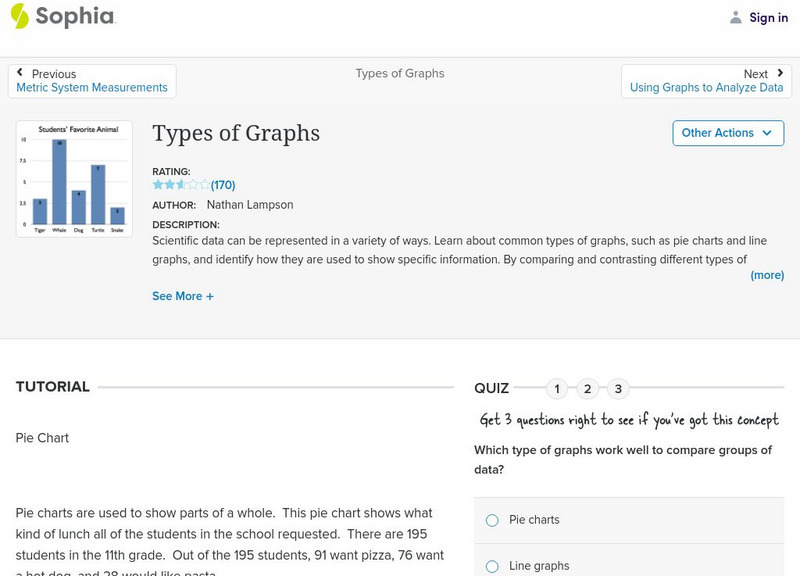
Sophia: Types of Graphs
This presentation allows the learner to visualize the different types of graphs used to display data in scientific investigations.
CK-12 Foundation
Ck 12: Physical Science: Scientific Graphing
[Free Registration/Login may be required to access all resource tools.] Usefulness and types of graphs.
Center for Innovation in Engineering and Science Education, Stevens Institute of Technology
Ciese Collaborative Projects: International Boiling Point Project
An Internet project designed to determine the greatest influence on the boiling point. After reading the project instructions and performing the experiment, submit your data and compare your results to other classes from around the world.
TeachEngineering
Teach Engineering: A Lego Introduction to Graphing
Students use a LEGO ball shooter to demonstrate and analyze the motion of a projectile through use of a line graph. This activity involves using a method of data organization and trend observation with respect to dynamic experimentation...
ClassFlow
Class Flow: Fitting Models to Data
[Free Registration/Login Required] A basic premise of science is that much of the physical world can be described mathematically and many physical phenomena are predictable. This scientific outlook took place in Europe during the late...
Science Education Resource Center at Carleton College
Serc: Measuring and Graphing Toy Water Animal Growth
Lesson involves scientific investigation and knowledge of units of measurement. Students will select and submerge a growing water animal toy, predicting and measuring its growth of at least three places of metric measurement of distance...
NASA
Nasa: Why Is Carbon Important?
Students explore the relationship between atmospheric carbon dioxide concentrations and temperature, and how these relate to climate change. Graph and map data are used as evidence to support the scientific claims they develop through...
Science Education Resource Center at Carleton College
Serc: Adventures at Dry Creek
This educational module enables students (5-12) to experience ongoing research of University of California paleontologists studying about life in Montana 60-70 million years ago. It gives students the opportunity to experience the...
Alabama Learning Exchange
Alex: How Sweet It Is
As part of the study of Matter, the students will determine the density of standard percent sugar solutions through hands on experimentation. In laboratory groups, students will graph a standardized curve of the experimental data. The...
Alabama Learning Exchange
Alex: Bloodstain Pattern Doesn't Lie
Students will formulate a hypothesis about the relationship (linear, direct, indirect, etc.) between the distance a drop of blood falls and the diameter of the splatter it makes. To test their hypothesis, the students will work...
Texas Instruments
Texas Instruments: Beverage Tests
In this activity, students determine the pH of liquid samples. They get familiar with the pH scale, create graphs comparing pH levels, and compare data displayed as a scatter plot, a boxplot, a histogram, and a bar graph.
Alabama Learning Exchange
Alex: Away We Go!
Students will survey various classes about the type of transportation that delivers them to school. Students will then combine data and with the help of a teacher create a virtual graph. This lesson plan was created as a result of the...
Science Education Resource Center at Carleton College
Serc: Reasons for the Seasons
A well-designed science investigation that has students examine and graph seasonal temperature data from cities at different latitudes. They describe trends they see, and explain what they think causes these trends. They then identify...
Other
Gphsf: Basic Project Timeline
This resource is a short piece, part of a larger page, on conducting your experiment. It contains a lot of good advice.


![Brebeuf Jesuit Preparatory School: The Scientific Method (Part 3) [Pdf] PPT Brebeuf Jesuit Preparatory School: The Scientific Method (Part 3) [Pdf] PPT](https://static.lp.lexp.cloud/images/attachment_defaults/resource/large/FPO-knovation.png)


