Curated OER
Insect Monitoring
Students participate in an interactive lesson using the scientific method to study biodiversity. In this insect monitoring lesson, students simulate the layers of soil and the insects that would live there. Students design...
Curated OER
Plot! Analyze! Draw your Conclusions!
Students download data reported from the Global Sun Temperature Project website. They graph and analyze the data looking for trends and patterns. They prepare a class report with their observations and post it to the website.
Curated OER
Measuring the Speed of a Wave
Students create an experiment in which they measure the speed of a wave and record the data in a graph. They work in small groups to write the procedure for the experiment and share it with another group for cross checking of the...
Curated OER
US Historical Climate: Excel Statistical
Students import US Historical Climate Network mean temperature data into Excel from a station of their choice. They are guided through the activity on how to use Excel for statistical calculations, graphing, and linear trend estimates.
Curated OER
The Big Bang Theory
Students will use scientific reasoning to formulate ideas about the formation of the universe using the Big Bang Theory. The use of critical thinking skills is part of the activity and the foundation of the scientific method will serve...
Curated OER
Stream Chemistry Monitoring
Students become familiar with real-world gathering of chemical data. The experience how the science is done: the nature of analysis, data collection, interpretation, and presentation. They study a nearby body of water for their experiment.
Curated OER
Do the Elephants Need Sunscreen? A Study of the Weather Patterns in Etosha
Students analyze the weather patterns in Namibia. They create a graph of the yearly temperatures and use the internet to gather information. They discuss how the weather goes in cycles in the area.
Curated OER
The Universe
Middle schoolers describe what scientists mean by an "expanding universe" in their own words. They explain how scientists comprehend the universie is expanding. Students comprehend the vast scale of the universe. They comprehend how...
Curated OER
Stellar Observations
Ninth graders study the uses of spectroscopy and the operation of the Hubble space telescope. In this astronomy lesson students complete a lab activity that includes graphing star color and temperature.
Curated OER
Fishkill
Students analyze data to determine the effect of thermal pollution on a certain species of fish. They graph temperature and dissolved oxygen and make inferences on the impact a change in temperature could have on the fish. As a class...
Curated OER
Discovering a Law of Space Physics
Learners use data collected by an astronomer to determine the relationship between the time it takes the planet to orbit the sun and the average radius of the planet's orbit around the sun. Students use trial and error to find the...
Curated OER
Sea Surface Temperature Trends of the Gulf Stream
Students use authentic satellite data to produce plots and graphs of sea surface temperature as they explore the seasonal changes of the Gulf Stream.
Curated OER
Sea Surface Temperature Trends of the Gulf Stream
Students explore the importance of the Gulf Stream. Using a NASA satellite images, they examine the sea surface temperature. Students collect the temperature at various locations and times. Using spreadsheet technology, they graph the...
Curated OER
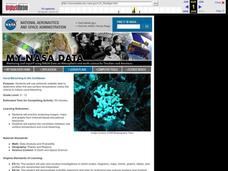
Coral Bleaching in the Caribbean
Students use authentic satellite data on the NASA website to determine when the sea surface temperature meets the criteria to induce coral bleaching.
Curated OER
Sea Floor Spreading II
Students import ocean bathymetry data from text files. They then graph these observations along with model predictions to assess the model's ability to simulate observed topographic features of the North Atlantic. Students use Excel to...
Curated OER
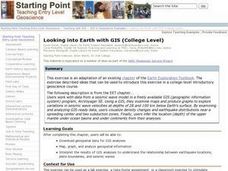
Looking into Earth with GIS
Students work with data from a seismic wave model in a freely available GIS (geographic information system) program, ArcVoyager SE. Using a GIS, they examine maps and produce graphs to explore variations in seismic wave velocities at...
Curated OER
You Gotta Have Heart
Ninth graders investigate the concept of relations and interpret graphs and tables. They analyze given data and look for a pattern to determine if the numbers represent a function. Students practice solving scientific word problems that...
Curated OER
Plants Under Attack
Third graders will identify the four needs for plant survival and gain skills and confidence in using scientific measurement tools, probes as well as the spreadsheets and graphing capacity of a computer to represent and analyze data.They...
Curated OER
When is Dinner Served? Predicting the Spring Phytoplankton Bloom in the Gulf of Maine (College Level)
Students are able to explain the ecological importance of phytoplankton. They describe the components that influence a phytoplankton bloom. Students interpret satellite images in order to correlate buoy data.
Curated OER
The Breathtaking Nature of the Urban Explosion, Part 2
Students explore ozone levels. They measure the concentrations of ground-level ozone in the atmosphere. Students observe changes in the concentrations of ozone over time. Students complete a data sheet to record ozone readings over a...
Curated OER
Assessing Water Quality in a Local Creek by Sampling Aquatic Macroinvertabrets
High schoolers experiment collecting macroinvertebrates from a stream and identify the specimens collected and then log in the information into a data table. From the data, they make qualitative and quantitative interpretations of water...
Curated OER
Class Final Report - Global Sun Temperature Project
Students reflect on the data they have analyzed during the Global Sun Temperature Project. They use the project website as a resource for their observations, draft a class report and post it on the Internet.
Curated OER
Aruba Cloud Cover Measured by Satellite
Students analyze cloud cover over Aruba. They compose and submit written conclusions which include data, analysis, errors in data collection, and references.
Curated OER
Sea Floor Spreading II
Students import ocean bathymetry data form either the topex web site or text files. They then graph these observations along with model predictions to assess the model's ability to sumulate the observed topographic features of the North...

