BW Walch
Creating and Graphing Linear Equations in Two Variables
This detailed presentation starts with a review of using key components to graph a line. It then quickly moves into new territory of taking these important parts and teasing them out of a word problem. Special care is...
Urbana School District
Physics Intro, Kinematics, Graphing
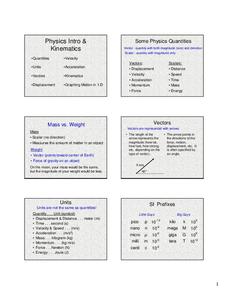
Some consider physics the branch of science concerned with using long and complicated formulas to describe how a ball rolls. This presentation, while long, is not complicated, yet it covers rolling, falling, and more. It compares vectors...
Curated OER
Understanding Latitude and Longitude
Teaching learners about latitude and longitude can get a little complicated. Present the concept by first representing it as a graph. Just like finding a location on a graph using the x and y-axis, learners will be able to locate items...
Curated OER
"Dead-Zones" and Coastal Eutrophication: Case-Study of Chesapeake Bay
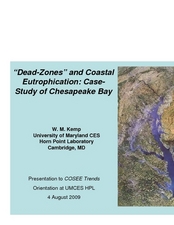
Take an in-depth look at nutrient loading, eutrophication, and hypoxia using data on The Chesapeake Bay as an example. This comprehensive presentation includes detailed graphs, photos, and details about the changes in marine organism...
Bowels Physics
Newton's Third Law and Law of Gravitation
Why was Sir Newton so important to the field of science? Pupils discuss his contributions, specifically his Third Law, as they learn about gravity and the center of mass. They work multiple problems to ensure their understanding and...
National Energy Education Development Project
Exploring Nuclear Energy
Every 18–24 months, nuclear power plants shut down to remove their used uranium fuel, a radioactive waste. Show learners how energy is made and used around the world and then focus on the United States' usage. Viewers then specifically...
Curated OER
The Coastal Ocean: Estuaries and Continental Shelves
Amazing high-quality satellite imagery, photos, informational graphs, and detailed diagrams comprise this presentation on the movement of estuaries and the continental shelf. Data used as an example is from The Chesapeake Bay and because...


