Curated OER
Moo-Velous Butter!
Third graders investigate how temperature and motion (energy) create a chemical change that turns cream ( a liquid) into butter (a solid). They create a class pictograph of their favorite mils choices (white, chocolate, or strawberry)...
Curated OER
Surveying During a Basketball Game
Tenth graders conduct a survey at a high school basketball game. They compile and present the data as histograms or bar graphs.
Curated OER
Valentine's Day Math
First graders explore sorting and classifying. In this math lesson, 1st graders sort conversation hearts based on color. Students graph their results and enjoy the candy!
Curated OER
Graphing With Second Graders
Second graders sort M & M's and then enter the data into a spreadsheet in order to create a simple graph. After printing the spreadsheet generated graph, have students compare the printed graph with their paper graph.
Curated OER
Delicious Graphing
Fourth graders sort trail mix by type and use that information to create different types of graphs for comparing.
Curated OER
Reading Tally Charts #2
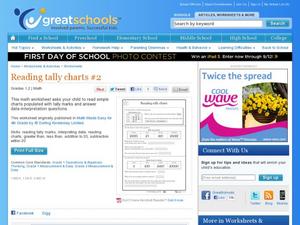
Keep count with tally marks! First graders practice reading tally marks with this straightforward learning exercise. They work with interpreting data from a chart, as well as working with addition and subtraction under 20. A great math...
Curated OER
Valentine's Day Math
First graders sort their candy hearts into piles according to color and record a tally mark under the color for each candy heart that they have on the worksheet. They then record the total amount of tally marks for each color of candy...
Curated OER
A Sweet Drink
Young scholars investigate reaction rates. In this seventh or eighth grade mathematics instructional activity, students collect, record, and analyze data regarding how the temperature of water affects the dissolving time of a sugar...
Curated OER
Make This Week's Lessons Pop(corn)!
Students create popcorn timelines, maps, and graphs; do popcorn science and math; explore popcorn history and nutrition; and munch leftover popcorn snacks too!,
Curated OER
The Wolf's Chicken Stew 100th Day Celebration
Young scholars celebrate 100 by reading Keiko Kasha's, The Wolf's Chicken Stew, graphing, and making 100 pancakes.
American Statistical Association
A Sweet Task
Candy is always an effective motivator! A fun math activity uses M&M's and Skittles to explore two-way frequency tables and conditional probability. The candy can serve a dual purpose as manipulatives and experimental data.
Curated OER
Hunger and Homelessness
Students graph and then reflect on how they would feel if they didn't have a snack when they were hungry. In this hunger and homelessness activity, students listen to the story "Lucky Money" and act out parts of the story. Students...
Curated OER
My Pyramid
Learners complete a graphing activity to learn about fruits and vegetables as well as their nutritional qualities. In this fruits and vegetables lesson, students complete a series of activities that help teach them about the health...
Curated OER
Cent Sense
Students identify money values. In this money lesson, students sort and group coins by value and investigate the cost of supplies needed for a snack. Students prepare snacks for a snack sale.
Curated OER
M & Ms in a Bag
Learners make predictions about the number and colors of M&M's in a snack size package. They create an Excel spreadsheet to record the data from their small group's bag, create a graph of the data, and discuss the variations of data...
Curated OER
Two Variable Inequalities
In this algebra worksheet, students solve inequalities using addition, subtractions and multiplication. They graph the inequalities with shading. There are 2 questions.
Curated OER
Nutrition and Fitness
Sixth graders investigate the food guide pyramid. They conduct Internet research, and plan a three day nutritional menu appropriate for teenagers. Students include three meals per day and a snack for each day on their menu, and...
Curated OER
Level 2 Test 2 Math Assessment
In this math assessment worksheet, students complete a 100 question multiple choice test. Included are: mixed operations, fractions, geometry, money, patterns, graphs, time and estimation. Text is written in all capital letters.
Curated OER
Lunchroom Trash
Students explore the amount of waste produced by humans. In this ecology lesson, students predict which lunch bag and its contents will produce the most waste. Leftover material is examined, amounts are recorded, and a bar graph is...
Curated OER
Foods and Languages of the World
Students review Mexico's location and language and learn to pronouns 10 new Spanish food words. Students listen as the book, Corn is Maize is read, touching and passing around an ear of Indian corn. Students discuss the contribution of...
Exploratorium
Jacques Cousteau in Seashells
Visionaries create images out of dots to demonstrate the eye-brain connection. Through this activity, they learn that the brain interprets data collected by the eye into recognizable information. Search online for "Jacques Cousteau in...
Curated OER
Dental Arithmetic: Sugar Clocks
Students analyze data about their teeth. In this data collection lesson plan, students determine how often their teeth should be brushed during the day. Students also estimate the amounts of sugar in 17 foods.
Curated OER
Raisin Cane
Students estimate and record the number of raisins in a snack-size box. They also graph their results and note the differences (+ or -) from their estimate and actual number.
Curated OER
What's on Your Plate?
Students examine the food that they eat and choose snacks that are healthy and low in fat. In this healthy food lesson students keep a food log of what they ate, graph the results and experiment with food to see which foods are high in...


