University of California
Seasons Lab Book
Unlock the mystery behind seasonal change with a collection of worksheets and activities. Whether they are drawing pictures of Earth's orbit around the sun or graphing the temperature and daylight hours of different locations...
National Wildlife Federation
Summer Midnight Sun
Sunlight hours and climate have a clear connection. Young researchers collect data about the sunrise and sunset times in an Arctic climate as well as the average temperatures. They then graph their data to make connections between the...
California Academy of Science
California's Climate
The United States is a large country with many different climates. Graph and analyze temperature and rainfall data for Sacramento and Washington DC as you teach your class about the characteristics of Mediterranean climates. Discuss the...
Curated OER
How Soluble Is It?
Is sugar more soluble than salt? Experiment with water and solubility with an elementary science activity. After interpreting data from a bar chart, fifth graders use different types of sugar to determine if the size of sugar particles...
Curated OER
Top Ten Summer Lesson Plans: Make the Kick Off to Summer Fun!
The right summer lesson plans can help both teachers and students spend the final days of school in a fun and productive way.
National Geographic
The Monsoon
Few things are as fascinating as the challenge of climbing Mount Everest. This lesson investigates how monsoon weather impacts climbers. To begin, you are instructed to show various video clips. The only one directly provided, however,...
Curated OER
Food chains at sea
Fifth graders interpret a table of data about food chains in the ocean. They create a food chain to represent the information on the table. Periwinkles eat seaweed, and crabs eat periwinkles - so who eats crabs? Extend the activity with...
Curated OER
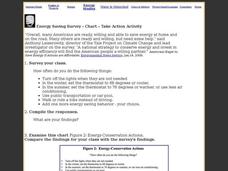
Energy Saving Survey - Chart - Take Action Activity
In this saving energy worksheet, learners survey the class about saving energy, examine an energy chart, and answer short answer questions. Students complete 4 tasks.
Curated OER
Graphing Sunspot Cycles
Students explore sunspots and then graph them to analyze the data. In this sunspot cycles lesson plan students complete an activity sheet and complete questions.
Curated OER
Plotting Sunspot Activity
Students explore how to graph sunspots using a solar graph. In this sunspots instructional activity students investigate sunspots and complete and evaluation worksheet.
Curated OER
Too Much Oxygen or Too Little?
In this oxygen worksheet, students analyze date about the oxygen levels in a river to determine the cause of the dying fish. This worksheet has 2 graphs, 12 short answer questions, and 2 graphic organizers.
Curated OER
Illustrate the Constellations
Students explore space science by participating in a star identification activity. In this astronomy lesson, students identify different star patterns and discuss the movement of stars across the sky as the seasons change. Students...
Science 4 Inquiry
States and Phases of Matter
Plasma is the most common phase of matter in our universe. Scholars explore the change of energy as molecules change phases of matter. They rotate through stations, graphing the changes in energy level.
Polar Trec
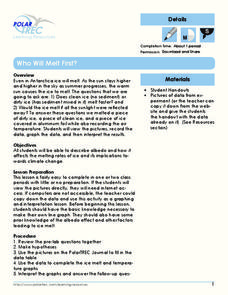
Who Will Melt First?
If the Greenland ice sheet melted, sea levels would rise by about 20 ft; if the Antarctic ice sheet melted, sea levels would rise by 200 ft. Scholars explore ice melting through the analysis of different ice samples, clean and dirty ice....
Curated OER
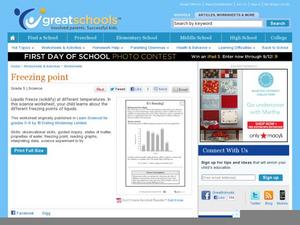
It's Freezing!
Here is a good worksheet for 5th grade scientists. In it, they look at a bar graph that shows the freezing point for a variety of liquids. Then, they are given a scenario of a certain liquid melting and freezing, and must determine which...
Curated OER
The Reason for the Seasons
Students compare graphs of their data that was generated on a NASA website. In this seasons lesson students complete a lab activity.
Curated OER
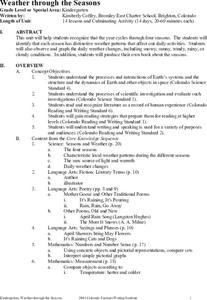
Weather through the Seasons
Students examine the year's cycles by observing the four seasons, their distinctive weather patterns that affect our activities and the weather changes that each brings. The fourteen lessons of this unit offer a good opportunity for the...
Space Awareness
Global Warming of the Atmosphere
Scientists know the amount of carbon dioxide in the atmosphere today is higher than at any point in the last 800,000 years. Scholars learn about the amount of thermic radiation absorbed by air and what happens to the rest of the...
Curated OER
Investigating Properties of Water: Temperature
Investigate how temperature affects the density of water and stratification that occurs in bodies of water when temperatures vary. Water of differing temperatures is given different colors to see the layers that form. The lesson is meant...
Curated OER
Hemlock Trees and the Pesky Pest, The Woolly Adelgid
Students review Excel and how to create graphs with this program. They create two graphs in Excel, one showing the average number of woolly adelgid egg sacks on the outer 15 cm of hemlock branch at sites sorted by latitude, then one...
Virginia Department of Education
Weather Patterns and Seasonal Changes
Get your class outside to observe their surroundings with a lesson highlighting weather patterns and seasonal changes. First, learners take a weather walk to survey how the weather affects animals, people, plants, and trees during...
Curated OER
Hurricane Predictions
For this hurricane worksheet, learners analyze and interpret a hurricane graph. They complete 5 short answer questions that follow.
Curated OER
Frost Depth
Learners explore the concept of frost depth. In this frost depth lesson, students conduct a scientific investigation that requires them to use a frost tube to measure, record, and graph frost depth data.
Curated OER
Solar Isolation Changes and the Sunspot Cycle
In this sunspot cycle and solar irradiation learning exercise, students use 2 graphs of daily total solar irradiance and sunspot activity to solve 3 problems. They find the average solar irradiance during a given time, they determine the...


