Curated OER
What Do You Like To Do the Most After School?-- Class Bar Graph
In this math worksheet, students collaborate to make a class bar graph which will display data on favorite leisure time activities. Students survey their classmates and plot the results on the graph. Six choices are given: games, read,...
Virginia Department of Education
May I Have Fries with That?
Not all pie graphs are about pies. The class conducts a survey on favorite fast food categories in a lesson plan on data representation. Pupils use the results to create a circle graph.
Curated OER
A Thanksgiving Survey
Students conduct a survey. In this math lesson, students design and conduct a survey about Thanksgiving foods. Students display the collected data in a graph and use the graph to determine what food to serve for a Thanksgiving meal.
Curated OER
A Thanksgiving Survey
Students take a survey then use the information gained from the survey to help plan a typical Thanksgiving dinner for our last day of class. They create a graph which corresponds the the data gathered during interviews.
Curated OER
Survey Says...
Learners practice taking surveys to answer different questions about radio. In this communications lesson, students brainstorm to create questions they can ask strangers about how often they listen to their radio. Learners turn the...
Curated OER
Problem Solving Application: Using a Bar Graph
In this bar graph activity, students use a set of 2 bar graphs to answer 6 related questions. Answers are included on page 2. A reference web site is given for additional activities.
Curated OER
Favorite Candy Bar Graph
Students decide on six different types of candy bars to include in a data collection activity. Working in small groups, they survey a target group in a set amount of time. They access a Internet based graphing tool to create a bar graph...
Curated OER
Local Traffic Survey
Students conduct a traffic survey and interpret their data and use graphs and charts to display their results.
Curated OER
Favorite Food
Students are given three choices of food. They then decide on their favorite and predict what the class's favorite food will be. After the teacher enters the data into the computer, students gather around the computer to view the...
Curated OER
Play It
There are a number of activities here that look at representing data in different ways. One activity, has young data analysts conduct a class survey regarding a new radio station, summarize a data set, and use central tendencies to...
abcteach
What is Your Favorite Month?
A simple worksheet that helps learners conduct a survey is here for you. In it, pupils collect data on their family and classmate's favorite months. Youngsters use tally marks in the spaces provided to keep track of the answers. Once...
Curated OER
Look Into My Eyes!
Students explore collecting, analyzing, and graphing information. They collect data on the various eye colors of their classmates. Students tally the results and create a graph.
Curated OER
Invasives and Marsh Birds
Students are taught that invasive plant removal can have a variety of impacts. They are shown this by using graphs. Students view maps of vegetation change on Iona Island. They discuss implications of changes on marsh birds using data...
Curated OER
Day Four: Surveys and results
Students use expressions of frequency in the English language. In this ELL lesson, student survey their classmates and turn the information into a class bar graph.
Curated OER
Graphs: All About Our Class
Students respond to survey questions, discuss results, brainstorm ways to represent survey information, and create table of class results. They find mean, range, and percentages, and create graph to display results.
Curated OER
Graphing Your Favorite Pizza Topping
Fifth graders can survey the students just in their classroom, the grade level, or other grade levels. Upon finishing the surveys and compiling the data, the students can input their results in an Excel template or create their own...
Curated OER
Money Circulation: A Story of Trade and Commerce
Learners are introduced to the meaning, symbolism, and value of the quarter. They determine the percentage of total monetary value held in quarters and graph the results. Students infer about the U.S. Mint's distrubution of coins. They...
Curated OER
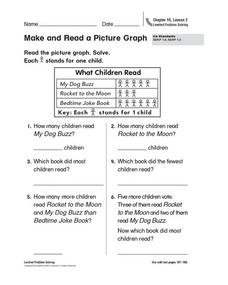
Make and Read a Picture Graph
What books do you like? Have your learners read and interpret a picture graph detailing a fictional class's favorite books. Consider conducting a survey of your learners' favorite books and plotting the results as a class!
Curated OER
"Graph It"
Students work in teams to conduct short surveys of their classmates. They show their results using at least two different types of graphs.
Students separate into teams and are asked that each team to choose something that they are...
Curated OER
Favorite Foods at Thanksgiving
Fourth graders study different types of graphs as a means of displaying information. They survey others to find their favorite Thanksgiving food and then graph the results using different types of graphs.
Curated OER
Survey Project
Eighth graders create a website using FrontPage. They use inserted forms to collect survey information and use Microsoft Excel and MS Word to create a presentation of the survey and the results.
Curated OER
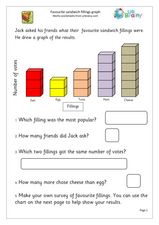
Simple Graph Activity
In this graphing learning exercise, students interpret a simple bar graph of favorite sandwiches, answering 5 related questions and then conducting their own survey and creating a graph of the results.
Curated OER
Graphing : research and record information
First graders create graphs. In this graphing lesson, 1st graders create a floor graph using their bodies to record information. They create picture graphs after collecting information.
Curated OER
The Numbers Tell the Story
Students demonstrate how to gather and interpret statistical data. For this data analysis lesson, students search for statistics on the health effects of smoking and place the information into charts. Students create these charts online...


