Curated OER
Graphing Groundhog Predictions
Students create a bulletin board graph illustrating Punxsutawney Phil's past predictions. Students also perform research about past predictions. The learners also graph the predictions and answer questions about the data.
Curated OER
Favorite Candy Bar Graph
Students decide on six different types of candy bars to include in a data collection activity. Working in small groups, they survey a target group in a set amount of time. They access a Internet based graphing tool to create a bar graph...
Curated OER
Graph It with Coffee!
Students interview employers and employees at local coffee shops about sales and profits and create graphs comparing and contrasting information obtained about the businesses.
Curated OER
Creating Circles
Students make a circle graph. In this graphing lesson plan, the teacher conducts a class survey, then demonstrates how to make a pie graph. When students are comfortable with the material, they use a worksheet to create their own graph.
Curated OER
The Human Graph
Students produce a graph of favorite colors. In this graphing lesson, students create a human graph based on their favorite color then the teacher transfers the data to a bar graph. Students compare the lines on the graph...
Curated OER
Favorite Days of the Week
In this bar graph worksheet, learners use the blank graph to survey classmates and record their favorite day of the week. Students think of one question about the graph and write it on the line.
Curated OER
Button Bonanza
Collections of data represented in stem and leaf plots are organized by young statisticians as they embark some math engaging activities.
NOAA
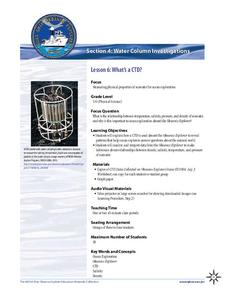
What's a CTD?
Why are the properties of the water important when exploring the ocean? Young scientists discover the tools and technology used in deep sea exploration in the fourth installment in a five-part series. Groups work together to...
Curated OER
Going Graph-y
Second graders listen to and dicuss the story Where the Wild Things Are. They play a pantomime game and act out various feelings so their classmates can guess. They listen for the frequency of certain words, and record their findings on...
University of Colorado
Spacecraft Speed
Space shuttles traveled around Earth at a speed of 17,500 miles per hour, way faster than trains, planes, or automobiles travel! In the 13th installment of 22, groups graph different speeds to show how quickly spacecraft move through...
Curated OER
Reading Graphs
Working independently or in teams, your class practices connecting graphs, formulas and words. This lesson includes a guided discussion about distance vs. time graphs and looking at how velocity changes over time.
Curated OER
Do These Systems Meet Your Expectations
This lesson is all about systems of equations and their graphs. Algebra learners create and solve systems of equation using tables and graphing. They identify the point of intersection of a system of equation, and discover what the...
NASA
Developing an Investigation
Watch as your class makes the transition from pupils to researchers! A well-designed lesson has scholars pick a solar wind characteristic to research. They then collect and analyze official data from the LANL website. This is the...
Ohio Department of Education
I Can Do This! Systems of Equations
Use tables, graphs, and substitution to solve systems of linear equations. An envelope of sample problems is passed around the classroom, and each learner has the opportunity to solve the system in the envelope. This is a great way to...
Statistics Education Web
Population Parameter with M-and-M's
Manufacturers' claims may or may not be accurate, so proceed with caution. Here pupils use statistics to investigate the M&M's company's claim about the percentage of each color of candy in their packaging. Through the activity,...
Curated OER
Graphing Canada
Students research a province of Canada choosing a question to investigate. They record their information on a worksheet that is provided and complete a graph. They present their bar graphs to the class.
Beyond Benign
Exothermic and Endothermic Reactions
How can you tell the difference between endothermic and exothermic reactions? Chemistry scholars perform and observe two chemical reactions, measure the temperature throughout, then draw conclusions about changes in energy from their...
Curated OER
Function Graphing--ID: 8252
Those graphing calculators can be tricky; good thing Texas Instruments has devised a lesson on how to use their TI-Nspire calculator to graph functions. Kids investigate functional notation as they graph ordered pairs in the form (a,...
EngageNY
Exponential Decay
I just bought that car, how can its value decrease already? Individuals use the data of a depreciating car value to create an exponential decay model. They then compare exponential decay and growth equations.
Kid Zone
Groundhog's Day Graphing
This Groundhog's Day, challenge scholars to predict, estimate, tally, and graph in a weather-themed lesson in which class members play the role of the groundhog to forecast the weather come February second.
Curated OER
Regents High School Examination: Living Environment 2005
The 2005 version of the Regents High School Examination in the area of ecology is as comprehensive as previous years' exams. It consists of 40 multiple choice questions on everything from the structure of DNA to the interactions within...
Curated OER
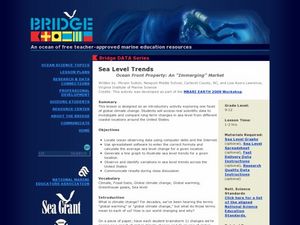
Sea Level Trends ~ Ocean Front Property: An "Immerging" Market
Young oceanographers take a look at sea level data from several cities over a few centuries. They use the data to fuel a discussion about what kind of changes are taking place and the impact they are having on the coastal ecosystems....
Curated OER
Visual Communication of Quantative Data
Students collect and analyze data based on academic performance. In this statistics lesson, students create graphs and analyze the data they created. They use positive, negative and no correlation to analyze the data.
Curated OER
Graphing with Stems-and -Leafs
Fourth graders examine the use of stem and leaf graphs. For this stem and leaf graph lesson, 4th graders participate in teacher led lesson showing the use of the graphs. They work in groups to collect data about peanuts before making a...


