EngageNY
Graphs of Exponential Functions
What does an exponential pattern look like in real life? After viewing a video of the population growth of bacteria, learners use the real-life scenario to collect data and graph the result. Their conclusion should be a new type of...
Bowland
Fashionista
So trendy! Show your class how to identify trends in sales patterns using mathematics. Scholars use a software simulation to collect data on age groups, price, and sales at a fashion store. This data allows individuals to determine the...
Anti-Defamation League
Pink Collar Jobs: Gender Segregation and Pay Inequality in the Workplace
Cartoons showing women in the workplace spark a discussion about being a business executive and claiming the corporate ladder. Small groups analyze data and create graphs that display essential information from the handouts. The class...
Virginia Department of Education
Weather Patterns and Seasonal Changes
Get your class outside to observe their surroundings with a lesson highlighting weather patterns and seasonal changes. First, learners take a weather walk to survey how the weather affects animals, people, plants, and trees during...
Curated OER
Explore Learning Exponential Functions
High schoolers graph exponential equations and solve application problems using exponential functions. They re-enact a story about a peasant worker whose payment for services is rice grains doubled on a checker board. They place M &...
Baylor College
Body Strength
Your young learners will discover how muscular strength and endurance can increase with this truly hands-on activity! Beginning by writing an acrostic for the word strength, class members then engage in tracking their ability to squeeze...
Curated OER
Science: Teddy Bear Nation
Students sort teddy bears according to types and then graph the results. They each bring a bear to class and then discuss their similarities and differences. Once the bears have been sorted into groups according to size and color,...
Curated OER
Ozone and Temperature Data Analysis, South Pole Antarctica
Students discuss the layers of the atmosphere, and the history of the ozone hole. They discuss the chemistry of the ozone formation. Students compare seasonal data collected with ozonesondes. They compare Antarctic and Arctic ozone hole...
Curated OER
Using GLOBE Data to Study the Earth System (College Level)
Learners use the GLOBE Website to locate and study environmental data. They use the GLOBE Graphing Tool to display data. Students describe the role of solar energy in the annual fluctuations of soil moisture. They describe reservoirs and...
Curated OER
Interpreting Data and Statistics
Young scholars define terms and analyze data. In this statistics lesson, students plot their data using bar and line graphs. They analyze their data after they graph it and apply the results to the Great Depression.
Curated OER
Graphing Surveys and Analyzing Data
Students analyze data and graph the results of their surveys. In this statistics lesson, students create graphs using excel to make graphs to be able to better observe their data. They conclude how great we as unique individuals.
Curated OER
The Demographics of Immigration: Using United States Census Data
Learners work together to analyze United States Census data on immigration. They compare and contrast the data and determine how immigration numbers have changed over time. They calculate percentages and make their own conclusions...
Curated OER
Data Analysis and Measurement: Ahead, Above the Clouds
Students explore and discuss hurricanes, and examine how meteorologists, weather officers, and NASA researchers use measurement and data analysis to predict severe weather. They plot points on coordinate map, classify hurricanes...
Curated OER
Handling Data: measure of Average
Fifth graders analyze data from a simple table. In this graphing lesson plan, 5th graders compare distributions. Students recognize that the mean helps them find the formula. Students answer questions on the mean, median, and...
Pennsylvania Department of Education
Multiplication Represented as Arrays
Third graders collect data about themselves and use in a line plot. In this analyzing data lesson, 3rd graders collect various sets of information,create a line plot and compare the data. Students complete a worksheet on their...
Curated OER
First Class First? Using Data to Explore the Tragedy of the Titanic
High schoolers analyze and interpret data related to the crew and passengers of the Titanic. They research information on a Titanic database to illustrate specific statistical conclusions, and whether or not social status affected the...
Curated OER
School Lighting Audit Data Analysis
Students analyze the data collected in the school lighting audit. They work together to write recommendations for more efficient lighting for their school. They practice using new vocabulary and working together with others.
Curated OER
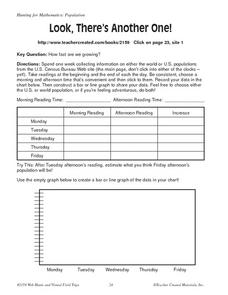
Look, There's Another One!
In this math worksheet, students spend a week collecting information on either the word or U.S. populations from the U.S. Census Bureau Web site. Students record their data in a chart and bar graph. Students also use the website to...
Curated OER
Jellybean Graphs
Second graders predict and graph data based on the color of jelly beans they think are in a handful. In this prediction lesson plan, 2nd graders will predict how many of each color jellybean are in a handful. Then they graph these...
Curated OER
The Human Line Plot
Fifth graders collect data and use charts and line plots to graph data. Through class surveys, 5th graders collect data concerning a particular subject. They graph their data using a line graph. Students make inferences and predictions...
Curated OER
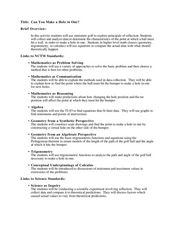
Can You Make a Hole in One?
Learners relate miniature golf to reflection of an image. In this algebra lesson, students collect and graph data as they study linear equations. They apply properties of graphing to solve real life scenarios.
Curated OER
Diagnosing Allergies Through Data Collection
Students research and organize information about allergies. In this data collection lesson, students watch a video about allergies. Students create a histogram using the information collected. Students complete the 'Displaying Survey...
Curated OER
Graphs and Spreadsheets
Young scholars collect data and present it in a graph and/or a spreadsheet, depending on their previous understanding of technology.
Curated OER
Usage and Interpretation of Graphs
Cooperative groups are formed for this graphing activity. Each group must construct a graph that represents how many eyelets (the holes for laces in shoes), are present in their group. A whole-class bar graph is eventually constructed...


