Texas Education Agency
Texas Gateway: Graphing Data to Demonstrate Relationships
Given problem situations, the student will graph data with a constant rate of change to demonstrate relationships in familiar concepts, such as scaling.
Concord Consortium
Concord Consortium: Smartgraphs: Equivalent Graphs
Students investigate graphs that are equivalent, in the sense that they represent the same data, though they look different because they employ different scales.
Concord Consortium
Concord Consortium: Smartgraphs: Graphs Tell a Story
Students match a word story to the correct set of graphs involving temperature change over time.
Government of Alberta
Learn Alberta: Math Interactives: Exploring Data Display and Graphs
This multimedia Learn Alberta math resource focuses on graphing data. In the video portion, students will see how math is involved in the display of merchandise in stores. The accompanying interactive component provides an exploration...
National Council of Teachers of Mathematics
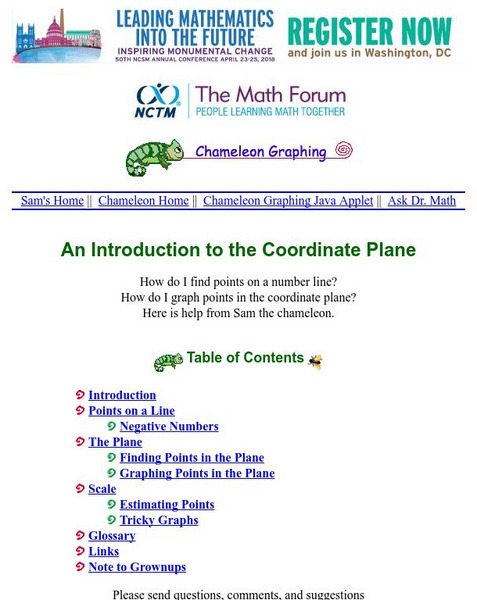
The Math Forum: Chameleon Graphing: Coordinate Plane
Dive into this introduction to graphing in the coordinate plane, and meet a chameleon named Sam. Sam will help guide you through graphing points on a line, using negative numbers, and graphing points in the coordinate plane.
TeachEngineering
Teach Engineering: Using Graph Theory to Analyze Drama
Students analyze dramatic works using graph theory. They gather data, record it in Microsoft Excel and use Cytoscape (a free, downloadable application) to generate graphs that visually illustrate the key characters (nodes) and...
TeachEngineering
Teach Engineering: Graphing Your Social Network
Students analyze their social networks using graph theory. They gather data on their own social relationships, either from Facebook interactions or the interactions they have throughout the course of a day, recording it in Microsoft...
TeachEngineering
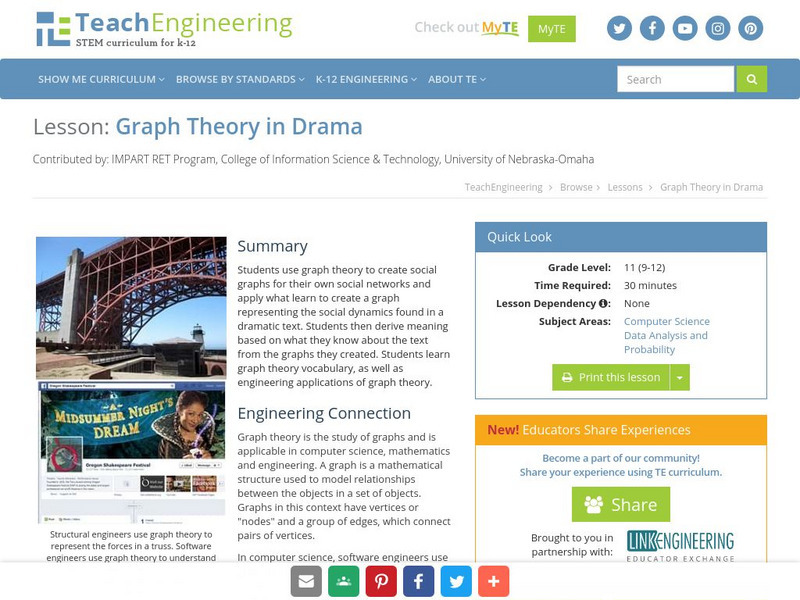
Teach Engineering: Graph Theory in Drama
Students use graph theory to create social graphs for their own social networks and apply what learn to create a graph representing the social dynamics found in a dramatic text. Students then derive meaning based on what they know about...
That Quiz
That Quiz: Practice Test: Graphs
This resource allows users to test their knowledge of graphs and graphing methods.
US Department of Education
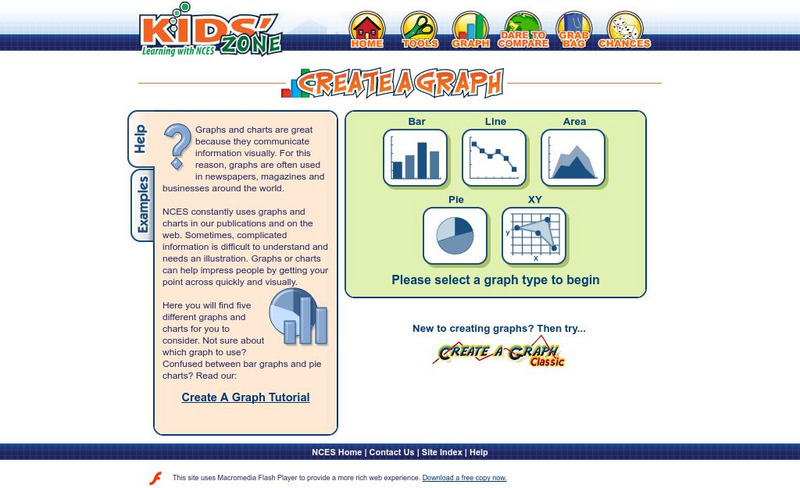
Nces Kids' Zone: Create a Graph
Resource from the National Center for Education Statistics allows you to create great bar graphs. Simply enter your information, choose appropriate colors, and voila!- you have a beautiful graph you can turn put into your report!
Beacon Learning Center
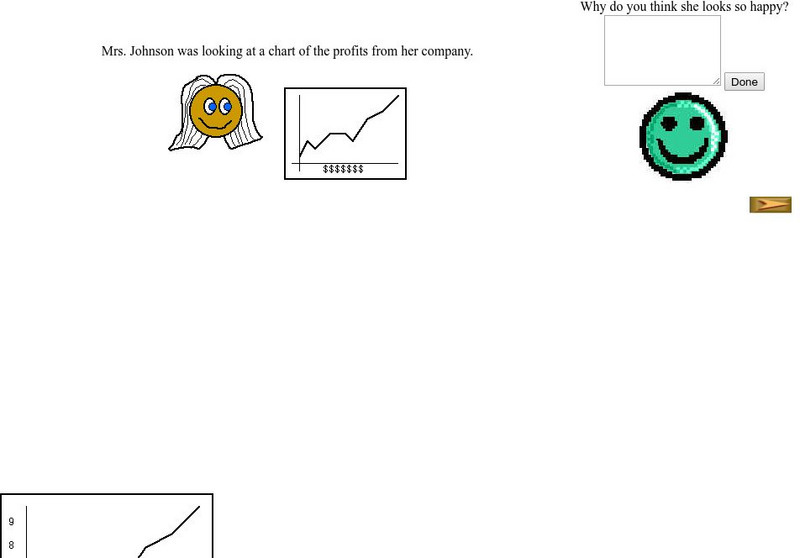
Beacon Learning Center: Interpreting Line Graphs
This site is a lesson on creating and interpreting a line graph. It explains how a line graph is created and then asks questions about what is learned from the data. Students type in open responses, and answers and feedback follow.
McGraw Hill
Glencoe: Self Check Quizzes 1 Graphing Functions
Use Glencoe's randomly generated self-checking quiz to test your knowledge of graphing functions. Each question has a "Hint" link to help. Choose the correct answer for each problem. At the bottom of the page click the "Check It" button...
University of Vienna (Austria)
University of Vienna: The Big Function Graph Puzzle
Interactive matching game where linear and quadratic expressions are matched to their associated functions graphs. Site features over 100 graphs, although only six are used at one time.
McGraw Hill
Glencoe: Self Check Quizzes 2 Circle Graphs
Use Glencoe's Math Course 2 randomly generated self-checking quiz to test your knowledge of circle graphs. Each question has a "Hint" link to help. Choose the correct answer for each problem. At the bottom of the page click the "Check...
TeachEngineering
Teach Engineering: Complex Networks and Graphs
Students learn about complex networks and how to represent them using graphs. They also learn that graph theory is a useful mathematical tool for studying complex networks in diverse applications of science and engineering, such as...
University of Vienna (Austria)
The Graphs of Sin, Cos, and Tan Maths Online
This applet allows the user to create the graphs of sin, cos, and tan by moving a scroll bar. The user can watch the unit circle and the graph simultaneously to see how the two are related. The user may also choose to see the angle...
Savvas Learning
Prentice Hall Science & Math: Graphing Calculator Help
This site provides very complete help guides for a variety of graphing calculator models, complete with pictures and step-by-step instructions.
NASA
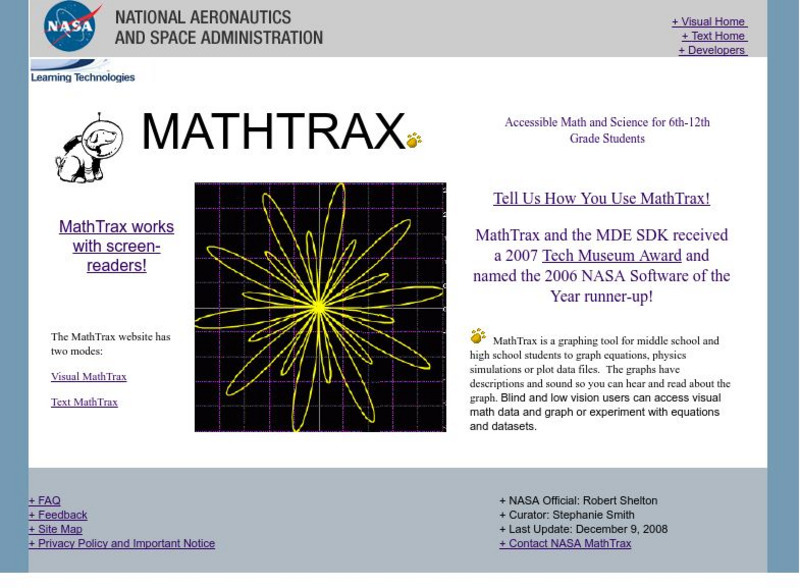
Nasa: Mathtrax Graphing Tool
NASA: Mathtrax is a graphing tool where the graphs includes descriptions and sounds. It is also adaptable for students who have visual accomidations.
Varsity Tutors
Varsity Tutors: Hotmath: Practice Problems: Functions and Their Graphs
Thirty-three problems present a variety of practice graphing a relation and checking to see if it is a function. They are given with each step to the solution cleverly revealed one at a time. You can work each step of the problem then...
TeachEngineering
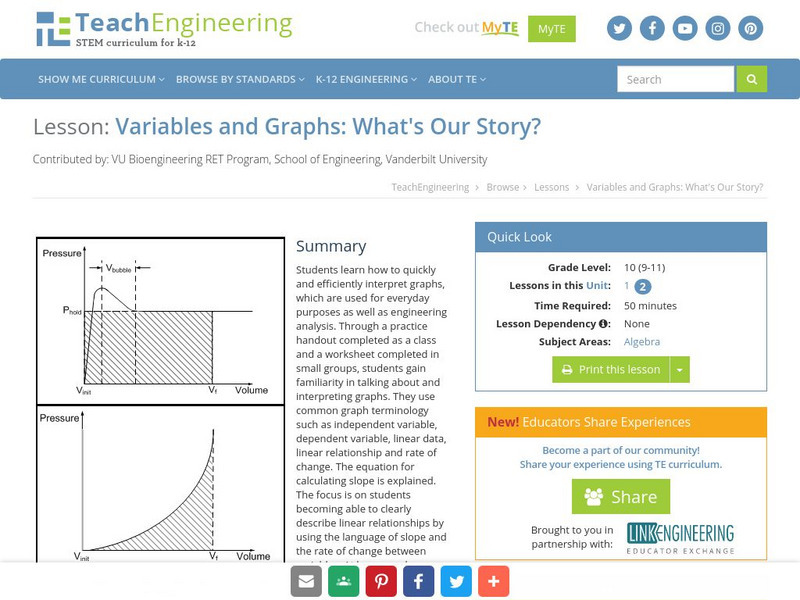
Teach Engineering: Variables and Graphs: What's Our Story?
Students learn how to quickly and efficiently interpret graphs, which are used for everyday purposes as well as engineering analysis.
Varsity Tutors
Varsity Tutors: Hotmath: Practice Problems: Graphing Linear Equations
Twenty-five problems present a variety of practice graphing linear equations. They are given with each step to the solution cleverly revealed one at a time. You can work each step of the problem then click the "View Solution" button to...
Texas Education Agency
Texas Gateway: Evaluating Data in Tables, Graphs and Charts
[Accessible by TX Educators. Free Registration/Login Required] In this lesson students look at examples of graphics, tables, charts, and graphs, and learn how to interpret their data. They will be able to use this skill to enhance their...
Varsity Tutors
Varsity Tutors: Hotmath: Algebra Review: Transformations of Graphs
Find a quick, concise explanation of the transformations of graphs: translations, reflections and rotations. Examples are given and clearly explained for each transformation.
Texas Education Agency
Texas Gateway: Informational Text: Synthesize Information in Charts and Graphs
In this lesson, you will learn how to understand the data found in charts and graphs, and at the end of the lesson, you will practice what you have learned.
Other popular searches
- Bar Graphs for Birthdays
- Templates for Bar Charts
- Inequalities and Their Graphs
- Function Table for Graphs
- Blank Graphs for Weather
- Blank Graphs for Economics
- Inequalties and Their Graphs
- Data for Graphs


