Curated OER
Weather Plots
Students investigate the relationship between temperature and humidity. The graphs of weather data gathered and plotted for for an assigned period of time are analyzed and the interpretations shared with the class.
Curated OER
Climographs
Learners identify trends and characteristics of climate zones and specific places within. Then, they graph annual climate trends (primarily Temperature and Precipitation) and create, interpret and extrapolate information based on...
Curated OER
Multiple Representations
Every topic or subject has its own special jargon. Learners work on their math vocabulary as it relates to basic algebra terms. They define and identify function, functional notation, ordered pairs, rate of change, slope,...
Curated OER
Trigonometry
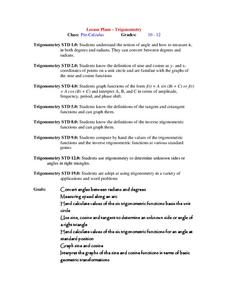
Learners investigate angles converting them from radians to degrees. In this trigonometry lesson, students work with angles and the six different trig ratios. They graph the functions representing each trig functions and identify the...
Curated OER
How Texas is Planning To Manage Its Water
Students research water management strategies in Texas. They analyze projected demand for water in the year 2050, interpret graphs and tables and then discuss the data as part of a written report. They research and map the locations of...
Curated OER
Recording Frequency
First graders analyze nursery rhymes and gather data about word frequency. In this frequency lesson, 1st graders create graphs and tables. Students interpret the data.
Curated OER
Interpreting Data and Building Hypothesis
Students define the term species, and graph species data together with previously collected data at the National Zoo. They interpret graphed data and recognize patterns in the streamside quadrant versus hillside quadrant. Students use...
Curated OER
Mapping the Ocean Floor
Students construct and interpret a line graph of ocean floor depth and a bar graph comparing the height/depth of several well-known natural and man-made objects and places. In addition, they calculate the depth of two points using sonar...
Curated OER
Aquatic Invertebrates
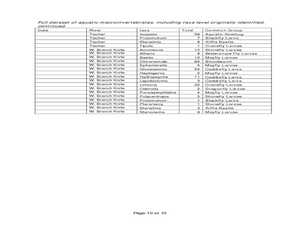
Students examine the impact that human development has on streams. In this stream sampling lesson students compare macroinvertebrate data and graph it.
Curated OER
Motion: Speed, Velocity, Acceleration and Networking
Students interpret a variety of motion graphs. In this physics lesson, students calculate the speed and acceleration of objects using numerical data from graphs. They apply what they have learned to solve real world problems.
Curated OER
Glacial Striation Investigation
Students operate a GPS unit to investigate the direction of glacier movement. They describe the motion of glacier movement by interpreting a graph. Students explain how scientists use glacier striations to determine glacier movement.
Curated OER
Energy and Changes of State
Students complete a variety of labs to help them explain how energy affects the changes in states of matter. They also be required to collect and record data, graph data, and apply interpretations of that data.
Curated OER
The Stock Market Game
Students participate in a variety of stock market games within their classmates. They study the concepts of stocks and investments as well as the criteria for selecting of stocks. Each student is shown how to keep track of the progress...
Curated OER
A Steep Hike
Students explore slope. In this middle school mathematics lesson, students analyze and interpret graphs as they investigate slope as a rate of change. Students use a motion detector to collect data as they walk at different...
Curated OER
Jack and the Beanstalk Math
Students listen to Jack and the Beanstalk and determine what they think are the most common words. In this Jack and the Beanstalk lesson, students reread the story, count the words they chosen and graph those words. Students graph...
Curated OER
Slopes of Lines
Students examine a graph and relate it to the real world situation it depicts. They investigate changes in an equation and the appearance of a line. They investigate the connection between the graph of a situation and the meaning of the...
Curated OER
Scatter Plots
In this Algebra I/Geometry/Algebra II worksheet, students create a scatter plot and analyze the data to determine if the data show any type of correlation. The four page worksheet provides extensive explanation of topic,...
Curated OER
Why Would I Owe My Soul to the Company Store?
Sixth graders listen to "Sixteen Tons" by Tennessee Ernie Ford and discuss what it means to owe one's soul to a store. In this mathematics lesson, 6th graders determine what a miner's income was minus his expenses graphing findings in a...
Curated OER
At the Edge of the Continent
Students study how to interpret a bathymetric map. They study the main features of the continental margin. They plot and graph bathymetric data. They think about and discuss the bathymetry of the edge of the cont
Curated OER
Piecewise Linear Integral
Young mathematicians solve and graph piecewise functions in this calculus lesson. They integrate linear functions containing restrictions and graph their answers using the TI.
Curated OER
Conduction, Convection, Radiation, Oh My!
Learners draw a line graph, and use graphing as a tool to discover more about conduction, convection and radiation. They should design their own experiment using heat sensitive paper to show they explain these 3 processes.
Curated OER
ART PROJECT
Eighth graders, after researching the properties of graphs of conic sections, absolute value and inverse relations, make a drawing of precise functions and relations from a specified list of equations. The final design should analyze the...
Curated OER
1st Grade - Act. 04: Chrysanthemum and Letter Tiles
First graders listen to story Chrysanthemum, discuss story with a focus on the length of Chrysanthemum's name, and compare the lengths of their own names using letter tiles, grid paper, and a class graph.
Curated OER
Gravity, Angles, and Measurement
Students relate math to real life scenarios. In this geometry lesson, students launch a ball tracking each launch using a graph. They analyze their data for speed, angles and distance, trying to improve on each launch.
Other popular searches
- Interpret Charts and Graphs
- Interpreting Bar Graphs
- Interpreting Line Graphs
- Interpreting Circle Graphs
- Interpret Graphs
- Reading Graphs and Charts
- Graphs Interpreting Data
- Bar Graph Interpretation
- Reading Graphs in Science
- Timed Reading Graphs
- Interpreting Graphs Algebra
- Math Interpreting Bar Graphs


