Curated OER
Water in the Texas Coastal Basins
Students, after researching a Texas coastal basin, map and graph the information they collect and then translate it into a short report to be presented to their classmates. They brainstorm unique ways to maintain Texas estuaries as well...
Curated OER
Smarty Pants
Students graph the colour distribution found in a packet of Skittle lollies, M&M's, Smarties or similar sweets. Results are compared and recorded against the results of other class members.
Curated OER
Cell Phone Plans
Students relate the use of a cell phone to math. In this algebra instructional activity, students collect data on the usage of their phones and plot it. They analyze the graph and make predictions based on the rate per minute.
Curated OER
Forces and Motion-The Downhill Racer
Students calculate a toy car's velocity and acceleration. In this force and motion lesson, students build ramps and attach a dropper to a toy car, which is released down the ramp. Students calculate and graph velocity and acceleration...
Curated OER
Building a Pill Bug Palace
Students make "pets" of isopods (potato bugs) to determine their preferred environment and food sources. They record their results on a bar graph and in a scientific report.
Curated OER
Mathematical Models with Applications: The Sounds of Music
Students use an electronic data-collection device to model the sound produced by a guitar string. They identify the graph of a periodic situation and use the graph to determine the period and frequency of sound waves.
Curated OER
The Box Problem
Students create graphic, algebraic and verbal ideas of functions. In this algebra lesson, students graph functions and identify the zeros of the functions. They find the domain and range and classify functions as relation or not.
Curated OER
Doing The School Run
Young scholars explore finding the percent of a numbers. They survey their peers to determine modes of transportation used in getting to school. Afterward, students organize information and create graphs and charts. They explore...
Curated OER
Slopey Math
Students identify the slope of a line and use it to solve real life problems. In this algebra lesson, students write linear equations in slope intercept form and make a correlation to its relation to the real world. They use the slope an...
Curated OER
Electromagnets: Winding Things Up!
High schoolers explore solenoids and electromagnets. After building an electromagnet, students use a TI Graphing calculator, a CBL 2 interface and a magnetic field sensor to measure the strength of a magnetic field. They create a graph...
Curated OER
Earthquakes
Eighth graders demonstrate the mathematical components of a scientific problem as well as illustrate how real world problems can be solved using math. They demonstrate math skills such as rate calculation, graphing, and linear equations.
Curated OER
Finding an Earthquake's Epicenter
Students examine the process used to identify the epicenter of an earthquake. They identify the Richter scale and interpret a seismograph reading. They also view photographs of the aftermath of earthquakes.
Curated OER
Swinging
Pupils examine and modify a swinging apparatus. They describe the motion of an object by its position, direction of motion, and speed. Students measure motion using a graph.
Curated OER
SURVIVING A COSMIC INVASION
Students read periodicals relating to radioacitivity and interpret a Geiger Counter. They work in small groups, share information and help each other explain the Geiger Counter. They discover the relationship distance to...
Curated OER
Integrated Social Studies and Math Lesson
Fourth graders study the American Civil War. They read and analyze information regarding the casualties of the Civil War, fucusing on Indiana soldiers. They graph the information and then write in their reflective journals responding...
Curated OER
Scientific Notation II: The Mantissa
Students after completing the Part II (of 2) scientific notation online lab exercises, manipulate and interpret large numbers expressed in the "mantissa and exponent" format of scientific notation.
Curated OER
Scientific Notation I: The Exponent
Students manipulate and interpret large numbers expressed in the "exponent" format of scientific notation.
Curated OER
Chicken Pox Math
Students will listen to a story of a boy with chicken pox and participate in a class discussion of chicken pox and what to do when you have a contagious disease. They will incorporate math by graphing who in the class has had the...
Curated OER
Chicken Pox Math
Second graders are read a story about a boy with chicken pox. As a class, they discuss what to do when you have a contagious disease and identify who in the class has had chicken pox. Using this information, they create a graph and use...
Curated OER
Natural Resources
Fifth graders begin the lesson plan by identifying the different types of natural resources. As a class, they discuss how environments are destructed and how the loss of one natural resource can affect the economy. Using a map, they...
Curated OER
Using Tiles to Solve Word Problems
Students solve problems using equations. In this algebra lesson, students identify the correct symbols and steps when solving word problems. They graph their lines and analyze the slope using tiles.
Curated OER
The ABC's of Industry
Learners define and explore Industry. They access times during the Industrial Revolution in America. Students view how business functions in any economy. They summarize the three sectors of industry by creating and interpreting a web...
Curated OER
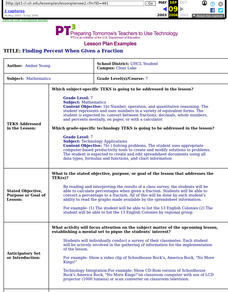
Finding Percent When Given A Fraction
Seventh graders calculate percentages when given a fraction. They convert a percentage to a fraction. All of this be done by each student's ability to read the graphs made available by the spreadsheet information.
Curated OER
Cool Times with Heat
Students work with thermometers to complete problems about temperature. They investigate cooling patterns, how location affects temperature, and what happens when water having different temperature is mixed. They measure temperature in...


