Curated OER
Butterfly Addition: Color by Numbers
Children learning to add numbers up to 11 develop the strategy of using the larger number as the first addend and counting on from there to find a sum. They define addition and review the meaning of the plus (+) symbol. To practice, they...
Curated OER
Mark Twain and Huckleberry Finn Introductory Lessons
“What is the role or function of controversial art? And, should children, our children, be required—forced—to study certain works they may find painful or humiliating or offensive?” Robert Zalisk’s question, found in his article, “Uproar...
Curated OER
Exploring Function Graphs
Tenth graders investigate three different sets of data that relate temperature to another variable in the physical world. These illustrate linear, inverse and exponential relationships.
Curated OER
Making Connections
Seventh graders relate patterns with higher math. In this 7th grade math instructional activity, 7th graders analyze different methods of portraying data. They relate the data to real life scenarios.
Curated OER
Linear Equations
Students solve linear equations by modeling. In this algebra instructional activity, students solve one and two step inequalities and equations. They use manipulative to create a visual of the steps.
Curated OER
More of U.S.
Explore graphical representation of a real-life data set and determine the exponential regression model for the data in your classroom. High schoolers also compare the estimated value to the given value by determining the percent error.
Alabama Learning Exchange
I'm Lovin' It: Finding Area Between Curves
Students explore the concept of finding the area between two curves. In this finding the area between two curves instructional activity, students model the logos of McDonalds, Nike, and Motorola on grid paper. Students find functions to...
Texas Instruments
Graphical Derivatives
Pupils solve functions using the derivative. They determine the derivative of a function based on its graph, then analyze different functions and draw a relationship and conclusion based on the graph.
Curated OER
Logarithmic Transformations
Using the TI calculator to visualize and make predictions, students perform transformation vertically and horizontally on logarithmic graphs in order to solve problems.
Curated OER
Slopes of Lines
Learners examine a graph and relate it to the real world situation it depicts. They investigate changes in an equation and the appearance of a line. They investigate the connection between the graph of a situation and the meaning of the...
Curated OER
Introduction to Tangent Lines using the TI-Nspire
Learners make mathematical argument using the concept of Limit. In this algebra lesson, student calculate the instantaneous rate of change from the linear graph. They use a TI-calculator to create a visual of the graphs.
Curated OER
The Box Problem
Students investigate the concept of functions and how they are used with polynomials. They practice finding the zeros of functions and graph polynomial functions for the help of giving solutions. Students interpret the curve of a line...
Curated OER
The football and Braking Distance; Model Data with Quadratic Functions
Students use the quadratic formula to solve application problems. The first problem relates to the path of a football thrown from the top of the bleachers. Students compute the time it will take the football to reach certain heights. In...
Curated OER
Precalculus: Function Models for Real-Life Situations
Students use calculators and "by hand" techniques to compare models of real-life data situations, determine the best model for a situation, and use their models to make predictions.
Curated OER
Graphing Linear Inequalities
Eighth graders extend skills for representing and solving linear equations to linear inequalities. Lesson activities build understanding and skill by plotting ordered pairs of numbers that either satisfy or do not satisfy a given...
EngageNY
Linear and Exponential Models—Comparing Growth Rates
Does a linear or exponential model fit the data better? Guide your class through an exploration to answer this question. Pupils create an exponential and linear model for a data set and draw conclusions, based on predictions and the...
Virginia Department of Education
Factors, Zeros, and Solutions
Factors, zeros, and solutions, oh my! Don't let your classes become overwhelmed with the vocabulary. An engaging lesson helps learners make a connection between factors, zeros, and solutions. Pupils explore the relationship between the...
EngageNY
The Slope of a Non-Vertical Line
This lesson introduces the idea of slope and defines it as a numerical measurement of the steepness of a line. Pupils then use the definition to compare lines, find positive and negative slopes, and notice their definition holds for...
EngageNY
Modeling a Context from Data (part 1)
While creating models from data, pupils make decisions about precision. Exercises are provided that require linear, quadratic, or exponential models based upon the desired precision.
West Contra Costa Unified School District
Point-Slope Application Problems
Create a linear equation for a problem when the intercept information is not given. The two-day lesson introduces the class to the point-slope form, which can be used for problems when the initial conditions are not provided. Pupils...
Howard County Schools
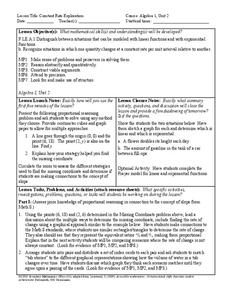
Constant Rate Exploration
Question: What do rectangles and bathtub volume have in common? Answer: Linear equations. Learn how to identify situations that have constant rates by examining two different situations, one proportional and one not proportional.
EngageNY
The Computation of the Slope of a Non-Vertical Line
Determine the slope when the unit rate is difficult to see. The 17th part of a 33-part series presents a situation that calls for a method to calculate the slope for any two points. It provides examples when the slope is hard to...
West Contra Costa Unified School District
Linear-Quadratic Systems
Why do I have to learn two different ways to solve linear-quadratic systems? Isn't one way enough? Learners first investigate the three possible situations for linear-quadratic systems (two, one, or zero solutions), then solve such...
Kenan Fellows
Designing and Analyzing Data Collected from Wearable Devices to Solve Problems in Health Care
Wearable devices have become more the norm than the exception. Learners analyze data from a sample device with a regression analysis in a helpful hands-on lesson. Their focus is to determine if there is a connection between temperature...
Other popular searches
- Linear Functions and Graphs
- Parent Functions and Graphs
- Functions and Graphs
- Graphs of Functions Calculus
- Linear and Nonlinear Graphs
- Algebra Functions Graphs
- Graphs of Functions Circles
- Represent Functions as Graphs
- Functions Graphs


