Curated OER
Exploring Graphs
Learners are introduced to connecting graphing in a coordinate plane to making scatterplots on a graphing calculator. Working in pairs, they connect points plotted to make a sailboat and complete questions on a worksheet as well as plot...
Curated OER
Fast Food Survey Using Bar Graphs
Second graders create a bar graph to pictorically represent the data collected from a survey of students. They use Excel to electronically create the graphs and data tallies. They then interpret their data using sentences to explain.
Curated OER
Iron For Breakfast
Third graders are challenged to use scientific thinking, they experiment and observe which objects are attracted to a magnet. Pupils use the evidence to construct an explanation as to what common property the objects attracted to a...
Cheetah Outreach
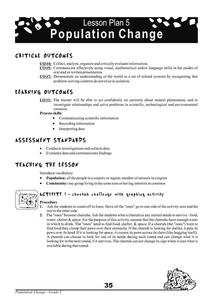
Population Change
Your youngsters become cheetahs in search of food, water, shelter, and space in a fun physical game that does a fantastic job of representing fluctuating species population based on resources available over years.
Curated OER
Dependence of Light Intensity on Distance
Hopefully you have a sensor interface for your physics class to use with graphing calculators when collecting data with a light sensor. If so, read on. Use this resource for learners to predict and then test whether or not the intensity...
Curated OER
Graphing Regions: Lesson 2
Students identify and analyze geographical locations of inventors. They each identify where their inventor is from on a U.S. map, discuss geographic patterns, and create a t-chart and graph using the Graph Club 2.0 Software.
Curated OER
Math Lesson: What Do You Want to Know? - Country Statistics
Students are able to identify the characteristics of a variety of graphs (i.e. bar graph, line graph, pie graph, scatter plot, population pyramids, etc.) They recognize how the type of data to be presented plays a role in choosing the...
Curated OER
What's My Pattern?
Students recognize, describe and extend patterns in three activities. They organize data, find patterns and describe the rule for the pattern as well as use the graphing calculator to graph the data to make and test predictions. In the...
Curated OER
Pendulum Lab in 9th Grade Physical Science
Ninth graders conduct experiments to determine what affects the rate of a pendulum's swing. Working in small groups, they identify an independent variable to study and create an experiment to test their hypothesis. When tests are...
Curated OER
Fast Food Survey Using Bar Graphs
Second graders conduct survey and sort data according to categories, construct bar graph with intervals of 1, and write a few sentences about their graphs.
Curated OER
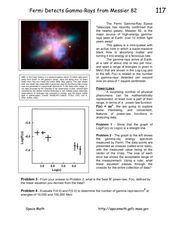
Fermi Detects Gamma-Rays from Messier
In this power law function worksheet, students use data from the Fermi Gamma-Ray Space telescope to apply the power law function to physical phenomena. Students use a graph to solve four problems.
Curated OER
Chemical or Physical Change?
Eighth graders participate in several science activities to note chemical or physical changes after discussion. They understand that all matter has definite structure which determines physical and chemical properties.
Curated OER
3-D Beginning Graphs
Students explore the concept of big and small. They collect objects from the classroom, sort them by size, and create a graph using Duplo stacking blocks.
EngageNY
Tides, Sound Waves, and Stock Markets
Help pupils see the world through the eyes of a mathematician. As they examine tide patterns, sound waves, and stock market patterns using trigonometric functions, learners create scatter plots and write best-fit functions.
Curated OER
Simple Harmonic Motion with Dr. DAQ
Students study the work and accomplishment of Galileo. For this physics lesson, students calculate the period of a pendulum's using a mathematical equation. They explain the different factors affecting its period.
Curated OER
We're Off To the Races!
Second graders use a magnet to "race" objects from one side of a racing track to another. They predict what the results are, then run the race. Pupils sort and graph which items were successfully moved, they attempt to race again. This...
Mathematics Assessment Project
Representing Trigonometric Functions
Discover the classic example of periodicity: Ferris wheels. Young mathematicians learn about trigonometric functions through Ferris wheels. They match functions to their graphs and relate the functions to the context.
Curated OER
Calculating & Graphing Using a Spreadsheet
Students use the lab apparatus to calculate the average velocity and average acceleration at several points and record the data. They use the spreadsheets to plot distance vs. time, velocity vs. time and acceleration vs. time graphs.
Curated OER
Don't Let Parabolas Throw You
Students identify relation, function, patterns and range. In this algebra lesson, students factor and graph quadratic equations. They use transformation to move the parabola around and make predictions.
Curated OER
Ohm's Law
If your future physicists know how to construct simple circuits, include resistors, and use a multi-meter to measure voltage, then you might employ this lesson on Ohm's law. Each lab group investigates the relationships among voltage,...
Curated OER
An Introduction to Sensors
Learners research the International System (SI) of units of measurements. They make measurements using the metric system. They study key concepts used in building and use of sensors, how sensors work and their role in measuring...
Curated OER
Scientific Inquiry: Periodic Motion
Students construct their own pendulum. In this physics lesson, students design an experiment to find the factors affecting its period. They formulate a conclusion based on experimental data.
Center of Excellence for Science and Mathematics Education
A Sick Astronaut
Aspiring astronauts graph, interpret, and analyze data. They investigate the relationship between two variables in a problem situation. Using both graphic and symbolic representations they will grasp the concept of line of best fit to...
Curated OER
Volume of Gas
Eighth graders investigate the effect of temperature on the volume of a gas in a closed container. They measure the height of the water in their beaker/container, conduct their experiment, and create a graph to illustrate their data.


