Mt. San Antonio Collage
Quiz 2: Polynomials
Four questions that get right to the polynomial point. High schoolers list all the attributes of a polynomial function, including finding all complex zeros. The last two questions prompt them to write a function based on the given zeros...
EngageNY
Analyzing a Data Set
Through discussions and journaling, classmates determine methods to associate types of functions with data presented in a table. Small groups then work with examples and exercises to refine their methods and find functions that work to...
Mathematics Vision Project
Modeling Data
Is there a better way to display data to analyze it? Pupils represent data in a variety of ways using number lines, coordinate graphs, and tables. They determine that certain displays work with different types of data and use two-way...
Houghton Mifflin Harcourt
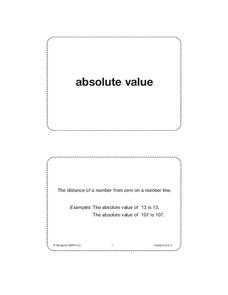
Unit 4 Math Vocabulary Cards (Grade 6)
Reinforce math vocabulary with a set of flash cards. Forty-eight cards offer boldly printed words, and their corresponding definition alongside an example with labels. Terms include absolute value, inverse operations, slope, and more!
Rice University
Introductory Statistics
Statistically speaking, the content covers several grades. Featuring all of the statistics typically covered in a college-level Statistics course, the expansive content spans from sixth grade on up to high school. Material comes from a...
Space Awareness
The Climate in Numbers and Graphs
Weather versus climate: weather relates to short time periods while climate averages the weather of a period of many years. Scholars learn about average temperature and precipitation in various climate zones and then apply statistics...
Curated OER
Using Tables
In this using tables worksheet, 9th graders solve and complete 10 various types of problems that include using tables to determine information. First, they write an equation to determine the total amount. Then, students define each of...
Curated OER
Bunny Cakes and Graphing
Third graders graph and analyze data relating to the book "Bunny Cakes" by Rosemary Wells. They listen to and discuss the book, vote on their favorite cake using Excel computer software, and discuss the results.
Curated OER
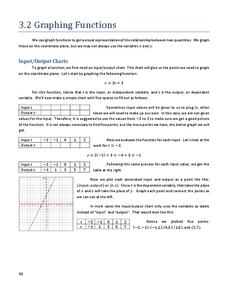
Graphing Functions
In this graphing functions worksheet, students write functions in logarithmic and exponential forms. They evaluate logarithms and determine the inverse of a function. Students graph functions. This six-page worksheet contains 20...
Curated OER
Using Parallel Axes To Discover Mathematical Interconnections
In this math worksheet, students graph the functions on parallel axes and observe the location of the slope point in relation to the x and y axes.
US Environmental Protection Agency
Carbon Through the Seasons
Meteorologists view an animated video by the Environmental Protection Agency to learn how the carbon cycle works, and then move into groups to analyze and graph actual data of the atmospheric carbon dioxide concentration from Hawaii's...
Curated OER
Using Averages to Create Graphs Through Excel
Sixth graders create and use a spreadsheet to make graphs which will be used to analyze Progress Report and Final Report Card grades. They practice finding the mean, median, mode, and range of a data set. Students also incorporate column...
Curated OER
Graphs and Ellipses
Students explore linear graphs, the parabola and the rectangular hyperbola.
Curated OER
Graph a Situation by Making a Table
Learners graph scenarios values by making a table. In this algebra lesson, students rewrite word problems using algebraic symbols. They make a table of the data, make a graph and analyze the data to extrapolate.
EngageNY
Multi-Step Problems in the Real World
Connect graphs, equations, and tables for real-world problems. Young mathematicians analyze relationships to identify independent and dependent variables. These identifications help create tables and graphs for each situation.
Inside Mathematics
Population
Population density, it is not all that it is plotted to be. Pupils analyze a scatter plot of population versus area for some of the states in the US. The class members respond to eight questions about the graph, specific points and...
Curated OER
Quantitative Data
For this quantitative data worksheet, pupils compute measures of central tendency, draw vertical line diagrams, and compare collected data. This 23-page worksheet contains approximately 100 multi-step problems. Explanations and examples...
EngageNY
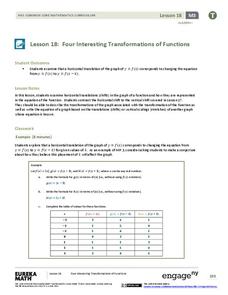
Four Interesting Transformations of Functions (Part 1)
Understanding how functions transform is a key concept in mathematics. This introductory instructional activity makes a strong connection between the function, table, and graph when exploring transformations. While the resource uses...
EngageNY
Solution Sets for Equations and Inequalities
How many ways can you represent solutions to an equation? Guide your class through the process of solving equations and representing solutions. Solutions are described in words, as a solution set, and graphed on a number line....
EngageNY
Properties of Trigonometric Functions
Given a value of one trigonometric function, it is easy to determine others. Learners use the periodicity of trigonometric functions to develop properties. After studying the graphs of sine, cosine, and tangent, the lesson connects them...
EngageNY
Exponential Decay
I just bought that car, how can its value decrease already? Individuals use the data of a depreciating car value to create an exponential decay model. They then compare exponential decay and growth equations.
EngageNY
Four Interesting Transformations of Functions (Part 2)
What happens to a function whose graph is translated horizontally? Groups find out as they investigate the effects of addition and subtraction within a function. This nineteenth lesson in a 26-part series focuses on horizontal...
Virginia Department of Education
Road Trip
Help plan a road trip with linear equations. Scholars consider two different rental car companies and write equations representing the cost for each company. They graph the system of equations to determine the conditions under which each...
Virginia Department of Education
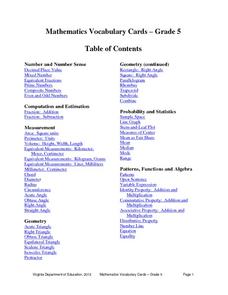
Mathematics Vocabulary Cards - Grade 5
Elevate your fifth graders' understanding of math concepts with a series of vocabulary posters. Featuring terms concerning probability and statistics, measurement, algebra, and decimal place value (and many more), the posters are sure to...


