Teach Engineering
Forms of Linear Equations
Linear equations are all about form. The fifth part in a unit of nine works with the different equivalent forms of linear equations. Class members become familiar with each form by identifying key aspects, graphing, and converting from...
Illustrative Mathematics
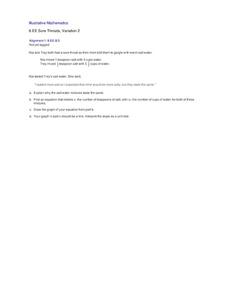
Sore Throats, Variation 2
What does math have to do with a sore throat? When you mix water and salt you have a great review of how to represent proportional relationships by an equation or graph. Here the proportions of the mixtures may be different, but the...
Curated OER
Solving Single-Variable Equations Part II, Simplifying
Seventh graders explore the concept of solving single-variable equations. In this solving single-variable equations lesson, 7th graders discuss how to simplify both sides of an equation. Students discuss using parenthesis and the...
Shodor Education Foundation
InteGreat
Hands-on investigation of Riemann sums becomes possible without intensive arithmetic gymnastics with this interactive lesson plan. Learners manipulate online graphing tools to develop and test theories about right, left, and midpoint...
Teach Engineering
Coordinates and the Cartesian Plane
The plot thickens to get a functional understanding. After a short review of plotting points on the coordinate plane, class members learn the difference between functions and relations in the second lesson in a series of nine. They show...
Teach Engineering
The Challenge Question
A research position becomes a modeling job. The introductory lesson in a series of nine presents the challenge of analyzing a set of bivariate data. The class brainstorms what the data may represent. Pupils must decide what is needed to...
Curated OER
Graphs and Functions
Use this series of activities to introduce learners to graphing functions. They graph both linear and quadratic equations by hand and with a Graph Sketcher Tool. Several imbedded links and handouts are included in the lesson.
SaveandInvest.org
Introduction to Earning Interest: Grades 11-12
Does your bank pay you for allowing them to hold your money? Class members investigate three different ways money can make more money. Topics include certificates of deposit, statement savings accounts, and money market accounts. This...
Teach Engineering
Bone Mineral Density Math and Beer's Law
Hop into a resource on Beer's Law. A PowerPoint presentation introduces Beer's law as part of calculating bone density from X-ray images in the sixth lesson in the series of seven. Individuals work on practice problems with this law and...
Curated OER
How Many Frogs?
Students explore the concept of linear regression. In this linear regression lesson, students find the line of best fit for a set of data pertaining to a frog population. Students use their line of best fit to predict the frog population...
West Contra Costa Unified School District
Exploring Quadratics and Graphs
Young mathematicians first graph a series of quadratic equations, and then investigate how various parts of the equation change the graph of the function in a predictable way.
Alabama Learning Exchange
Fortune Properties
Complete identity and equality property problems in hands-on activities. Smart cookies identify the identity and equality properties. They complete a review of order of operations, watch an online video, and make a foldable with the...
Curated OER
Y-Intercept and Slope Intercept Form
Alegebra amateurs identify the slope and the y-intercept given a linear equation in slope-intercept form by correctly completing some in class problems. They write the linear equation in slope-intercept form that corresponds to the given...
Curated OER
Solving Systems of Equations
Students identify the quadrants and axis of a coordinate plane. In this algebra lesson, students discover the ocrrect way to graph using the coordinate plane. They discuss the relationship between x and y values, domain and range and...
Virginia Department of Education
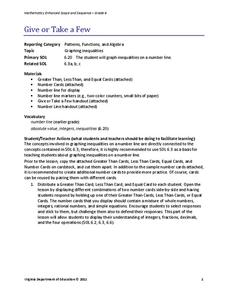
Give or Take a Few
Young mathematicians extend their knowledge of rational numbers on a number line to graph inequalities by first using number cards to compare rational numbers. They finish by using similar reasoning to graph inequalities on a number line.
Curated OER
Rainbows, Bridges & Weather, Oh My!
Explore how real-world applications can be parabolic in nature and how to find quadratic functions that best fit data. A number of different examples of modeling parabolas are explored including a student scavenger hunt, the exploration...
Curated OER
Sliding into Equations
Ninth graders translate sentences into equations. They translate equations into sentences. They solve real life problems using verbal models to write equations. They create a problem solution graphic organizer in their journals.
Curated OER
Test On Analytic Geometry/ Play Green Globs
Students engage in a lesson that focuses on analytic geometry. The lesson asked them to apply skills of relating equations when plotting them on the coordinate plane. Students construct the equations using specific criteria and apply them.
Curated OER
Graphing Systems of Inequalities
Solve equations and graph systems of inequalities. Designed as a lesson to reinforce these concepts, learners revisit shading and boundaries along with solving linear inequalities.
Curated OER
Left Hand, Right Hand - Solving Systems of Equations
Students compare the speed at which they write with their left hand to the speed at which they write with their right hand. The experiment serves as a vehicle to help students develop a conceptual understanding of the three different...
Curated OER
What's Your Shoe Size? Linear Regression with MS Excel
Learners collect and analyze data. In this statistics lesson, pupils create a liner model of their data and analyze it using central tendencies. They find the linear regression using a spreadsheet.
Curated OER
Data Displays with Excel
Students collect and analyze data. In this statistics lesson, students display their data using excel. They plot the data on a coordinate plane and draw conclusion from their data.
Curated OER
Best Practices of Technology Integration
Students participate in a lesson in order to practice using systems of equations in order to graph them. A cumulative project in the form of a brochure, web page, or interactive kiosk make this lesson more engaging.
Curated OER
Finding our way
Tenth graders investigate the use of a GPS. In this math lesson, the students will use a GPS type system to determine positioning in two dimensions. They will complete questions out of a student workbook.


