Curated OER
The Science of Weather: Hurricanes
Learners use this USA today activity to learn about hurricane season. In this hurricane lesson, students study the map of the earth and hurricane science. Learners complete discuss questions. Students draw a map of the United States and...
Curated OER
Weather Map Challenge
In this weather worksheet, students use a weather map to answer ten questions about the information found on a weather map and what the symbols mean. They find the cities with the highest and lowest temperature as well as the cities...
Curated OER
Today's Weather
In this weather worksheet students complete an interactive activity and complete a series of short answer questions on temperature and weather fronts and predict the weather.
Curated OER
Earth Science
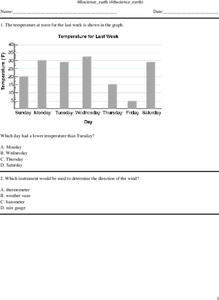
For this Earth science worksheet, 4th graders answer multiple choice questions about temperature, weather instruments, heat, light, and more. Students complete 25 questions.
Curated OER
Global Warming Statistics
Learners research and collect data regarding temperature changes for a specific location and find the mean, median, and mode for their data. In this climate change lesson, students choose a location to research and collect data regarding...
Curated OER
Temperature Graphing
Students analyze temperature variations throughout the world by using computer graphing of select major national and international cities. After analyzing their findings, students write a paragraph explaining their data.
Curated OER
What is Temperature?
Students study the effects of temperature and air expansion. In this temperature lesson plan, students discuss temperature and participate in a role play of low energy and high energy molecules. Students then discuss their activity and...
Curated OER
Temperature Stories
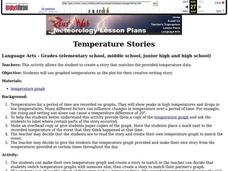
Students create a story that matches the provided temperature data. They use graphed temperatures as the plot for their creative writing story.
Curated OER
Worksheet 3: Earth's Climate System II
A diagram of a mountain range and the prevailing winds is shown at the top of the page. Meteorology pupils describe the weather conditions at different points on the diagram. They explain the El Nino effect and why evaporation and...
Illustrative Mathematics
Telling a Story With Graphs
Turn your algebra learners into meteorologists. High schoolers are given three graphs that contain information about the weather in Santa Rosa, California during the month of February, 2012. Graph one shows temperatures, graph two...
Curated OER
The Abiotic Limits to Purple Loosestrife Growth
Students investigate the effects of soil temperature, water availability, photo period and other variables of the growth of purple loosestrife. They observe the growing conditions of plants and alter them by adding water, isolating the...
Curated OER
Numbers in the News
Students examine numbers used in the real world by reading newspapers. In this number identification lesson, students explore popular newspapers and attempt to find numbers in prices, temperatures, dates, sports scores, etc. Students...
Science 4 Inquiry
Investigating How Heat Flows
It is impossible to cool down a glass of water by adding ice. Young scientists explore heat transfer through videos, experiments, and interactive games. They quickly catch on that the water melts the ice and things aren't always as they...
Curated OER
Temperature Bar Graph
Students explore mean, median and mode. In this math lesson, students analyze temperature data and figure the mean, median, and mode of the data. Students graph the data in a bar graph.
Curated OER
Temperature Graphing
Fifth graders analyze temperature variations throughout the world by using computer graphing of select major national and international cities.
Curated OER
Diurnal Temperature Changes and Water Vapor Content
Students determine how much moisture in the air affects the diurnal temperature range. They investigate to determine the different climatological regimes of both the Southern Plains and the world. and greenhouse gases effect the earth's...
Curated OER
What Causes Irregular Temperature Patterns?
Students examine common trends in climate across the U.S. They identify the anomalies in hot-cold temperature differences in the U.S and locate them on the map using latitude and longitude coordinates.
Curated OER
Celsius or Fahrenheit?
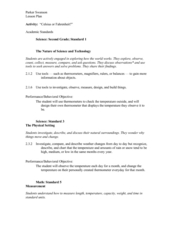
Second graders create a thermometer. In this Celsius or Fahrenheit lesson, 2nd graders create an individual thermometer to use for measuring the temperature. Students convert the outside temperature.
Curated OER
Unit 1 Matter and Energy
Topping this worksheet is a comprehensive collection of notes about phase changes. The phase change graph is displayed, along with formulas for the gas laws, and information relating energy to change of phase. After reviewing these...
Curated OER
Weather Chart
Students select at least 6 cities from around the world to keep track of their high and low temperatures over a period of time.
Curated OER
In the Eye of the Hurricane
For this science worksheet, students read about temperature and thermal energy in a hurricane. Students also draw their own hurricane and label 5 different parts.
Curated OER
Design Your Own Imaginary Continent
For this continent worksheet, students design their own continent and include latitudes, mountain ranged, river, wind patterns, and temperature highs and lows. They also include a variety of cities in specified locations.
Curated OER
Weather Math Student Worksheet
In this weather math learning exercise, students will use weather.com to find the forecasted temperatures for their home town. Using data from the website, students will find the average highs and lows for their selected cities. Then...
Curated OER
Hot, Hot, Hot, Cold
Learners dance the image of falling snow. They move, swing, fall, and rise to music working to depict snow falling, the sun, and high/low movements. This is a well-thought out lesson that aids them in seeing movement as a form of...


