Curated OER
Bar Graphs
What are these bar graphs depicting? Novice data analyzers examine two basic bar graphs and answer three comprehension questions about each. The first graph shows tickets sold per date and the next is distances run per member of a cross...
Curated OER
Lesson #46: Bar Graphs and Line Graphs
In this bar graphs and line graphs instructional activity, students interpret bar graphs, line graphs, and box-and-whisker plots. They find the measures of central tendency. This three-page instructional activity contains notes,...
Curated OER
Double Bar Graphs - Homework 7.1
Your learners have seen basic bar graphs, but do they have experience reading double bar graphs? This worksheet details how to draw a double bar graph and provides an example with six accompanying questions. The final question asks...
Curated OER
Bar Graphs
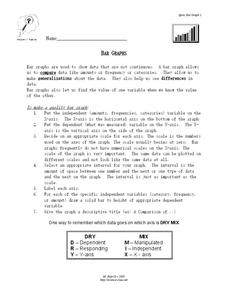
In this bar graph worksheet, students read about making quality bar graphs and they make a bar graph using given data. They answer 5 questions about their graph.
Curated OER
Horizontal Bar Graph-- Blank Grid
In this math worksheet, students use the blank horizontal bar graph to record and display any data and to learn the correct way to generate a bar graph. Spaces are marked for students to write in the title and labels; intervals of 1-10...
Curated OER
Graphs to Represent a Data Set
Here are Jack's hours for the week; scholars organize them into a bar graph in this data analysis instructional activity. They write the days along the y-axis and hours along the x-axis. Encourage labeling for this. Consider projecting...
Curated OER
Making A Horizontal Bar Graph
In this bar graph worksheet, students create a bar graph to display 6 scores from basketball games. Students will label the x and y axis and correctly plot the scores from the table provided.
Curated OER
Tim and Pat at the Store: Bar Graphs
Do you like candy? Tim and Pat go to the candy store every day after school. Can you use the chart to determine how much money they spend each day? Does one spend more than the other?
Curated OER
Horizontal Bar Graph: Changes in Nebraska Population
In this bar graph worksheet, students learn about the changes in Nebraska's population from 1880 to 2000 by studying a bar graph. Students answer 7 questions about the graph.
Curated OER
Bar Graph: Vacation Fun
In this bar graph worksheet, students use a bar graph showing pictures taken on a vacation to complete 6 related questions. Answers are included on page 2.
Curated OER
Making Bar Graphs
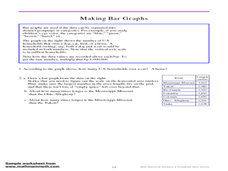
In this bar graph worksheet, students answer short answer questions about bar graphs. Students answer 1 question about a bar graph about a cat, and 3 questions about a bar graph about U.S. rivers.
Curated OER
Graphing Data
Seventh graders solve and graph 10 different problems that include various questions related to data on a graph. First, they create bar graphs to display the data given. Then, pupils determine the random sample of a population listing...
Curated OER
Animal Runners
In this collecting data worksheet, 4th graders use the data shown on how fast 6 animals can run to create a bar graph. Students follow the instructions on 3 directives for their bar graphs and answer 1 short answer question.
Curated OER
Endangered Species
In this geography learning exercise, students identify how to manipulate data on a range of endangered species. They create a bar graph of endangered animals from Africa, Asia, Australia, North America, or South America. Students use a...
Curated OER
Professor Panda's Pizza Graph
For this data analysis worksheet, students answer 11 questions using a bar graph that was constructed from the answers to a survey about pizza toppings. They use a secret code to determine the best place to have a pizza.
Curated OER
Super Bowl Champs
In this Super Bowl worksheet, students create line plots of all winners and losers of the Super Bowl. They create stem-and-leaf plots, scatter plots, and bar graphs of football data. This one-page worksheet contains 5 multi-step problems.
Curated OER
Frequency, Histograms, Bar Graphs
In this statistics worksheet, students plot and graph their data, then interpret the data using the correct form of graphs. There are 3 detailed questions with an answer key.
Curated OER
John's Trucking - Who Drove the Farthest
In this bar graph worksheet, students fill in a chart of who drove the furthest each day of the week based on a bar graph. Students complete the chart and answer 2 questions.
Curated OER
Human Population Growth
In this human population growth worksheet, students create a graph of human population growth and predict future growth using the data given in a chart. Students identify factors that affect population growth.
Willow Tree
Histograms and Venn Diagrams
There are many different options for graphing data, which can be overwhelming even for experienced mathematcians. This time, the focus is on histograms and Venn diagrams that highlight the frequency of a range of data and overlap of...
Curated OER
Jim, Tony, and Frank - The School Fundraiser
In this bar graph worksheet, students use the horizontal bar graph to count how much money each student collected for their fundraiser. Students answer 10 questions.
Curated OER
The Bread Shop
In this bar graphs worksheet, students study the bar graph to count the money Adam made during each day. Students answer 10 questions.
Curated OER
Nine Examples for Tables, Pictographs, Mean. Median, and Mode
In this graphical representation of data and measures of central tendency worksheet, students calculate mean, median, and mode and answer questions related to graphs, tables, and pictographs.
Curated OER
Where Did We Go on Holiday This Year?
In this differentiated whole-group activity worksheet, students list all the places they visited over the summer, record the places on a flip chart, calculate the distances on a road map and graph the data they collect.


