Curated OER
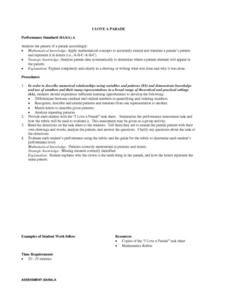
I Love a Parade
Pupils receive a worksheet that describes a parade. They tell what the 10th item in the parade will be. Students draw the parade, and tell the pattern they see using letters. Pupils design their own parade with the same pattern. They...
Curated OER
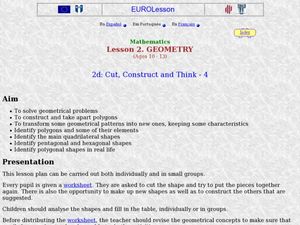
Cut, Construct and Think - 4
Learners identify polygons. In this geometric shapes lesson, students identify and describe polygons. Learners create new shapes out of the shapes they are given.
Curated OER
Can You Create a Congruent Figure
Fifth graders discover congruent figures by investigating graphs and manipulatives. In this geometry lesson, 5th graders identify congruent figures and patterns with their classmates. Students collaborate in groups to create...
Curated OER
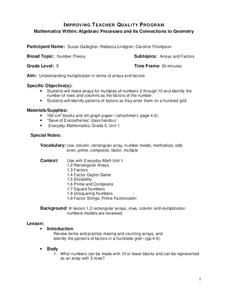
Mathematics Within: Algebraic Processes and Its Connections to Geometry
Fifth graders discover the connections between algebra and geometry. With a focus on arrays and factors, they are introduced to multiplication. They develop an array for multiples of 2 through 10 and identify the factors of each row....
Curated OER
My Peanut Butter is Better Than Yours!
Students explore the concept of statistical data. In this statistical data instructional activity, students read an article about the dangers of peanut butter to those who are allergic. Students perform a taste test of two different...
Alabama Learning Exchange
The State Capital of Stem and Leaf
Students explore the concept of stem and leaf plots. In this stem and leaf plots instructional activity, students plot the 50 US states' capitals on a stem and leaf plot according to the first letter of each state. ...
Curated OER
Logs of Straw: Dendocronology
Students investigate the age of trees by analyzing tree rings. In this dendocronology lesson plan, students examine sample images of tree rings and identify their age by the amount of rings. Students complete a chart...
Curated OER
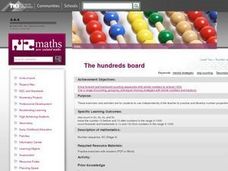
The Hundreds Board
Pupils explore the concept of multiples and use a hundreds board to add numbers and then graph them. Afterward, they use the sieve of Eratosthenes to identify prime numbers and discover how numbers change when you add or subtract by ten.
Curated OER
Peter The Butterfly
Students complete an interdisciplinary unit chronicling the life cycle and movement patterns of the butterfly. Through language arts, mathematics, and science activities, students identify various types of butterflies and document the...
Curated OER
Law of Sine and Cosine
Students solve problems using the law of sine and cosine. For this precaclulus lesson, students learn the law of DeMoivre's Theorem and Heron's theorem. They use both theorems to solve problems.
Curated OER
Investigating Scale Factors with the Geometer's Sketchpad
Students use Geometer's Sketchpad to examine the scale factor when in is applied to the length of a figure's sides. They look at how the scale factor affects the side lengths, perimeter, and area of the figure that result. They work with...
Curated OER
Calculator Count to 1000
Students develop an understanding that large numbers are made up of smaller ones. They develop multiples by skip counting with a calculator to 1000. They share their lists and patterns.
Curated OER
Geometric Basketball Court
Learners calculate the area and perimeter of a basketball court. In this geometry lesson, students differentiate between similarity and congruence of geometric objects. They test conjectures and use it to solve problems.
Curated OER
The Kangaroo Conundrum: A Study of a Quadratic Function
Students play a game and collect data for their graph. In this algebra lesson, students solve quadratic equations and identify properties of their graph. They describe the pattern created by the graph and the game.
Curated OER
CSI Investigation of Congruence and Similarity
Pupils differentiate between similarity and congruence using polygons. In this geometry lesson, students label triangles based on their properties. They find missing sides and angles using the interior sum theorem.
Curated OER
What's My Rule? Simple Linear Functions
Students investigate simple linear functions by trying to guess a function rule from inputs and outputs. They write the function rule in algebraic form.
Curated OER
A Study of a Quadratic Function
Students factor and solve quadratic equations. In this algebra lesson, students play a game as the collect and graph data. they identify properties of their parabola and make predictions.
Curated OER
An Introduction to Functions
Students investigate the growth and decay of an exponential function. In this algebra activity, students apply properties of exponent solve problems. They identify any patterns they see in the graphs.
Curated OER
Primary Geometry
Students identity simple geometric shapes. In this early geometry instructional activity, the teacher introduces students to triangles, squares, and rectangles, then students identify and classify the shapes as they are found in the...
Curated OER
Strongest Polygon
Students define and identify shapes by name. In this geometry lesson, students construct, identify and compare polygons based on the number of sides. They classify each shape based on their angle sum theorem.
Curated OER
Parallel-o-Home
High schoolers investigate the usage of parallel and perpendicular shapes in the real world. In this geometry activity, students investigate shapes for properties that are related to the real world. They relate all the properties of...
Curated OER
Solving Percents Problems
Students solve problems dealing with percents. For this algebra lesson, students convert between decimals and percents using factoring. They solve one step problems involving percents.
Curated OER
Batchelder News Channel Data Mix Up!
Students look at data in graphs with missing labels and use what they know about graphs to label the topics, titles, and axes of the graph. In this graph lesson plan, students pretend they are news reporters and have to fix their stories!
Curated OER
Line of Best Fit
Students explore the concept of linear regression. For this linear regression lesson, students do a Barbie bungee activity where they collect linear data. Students plot their data using a scatter plot. Students determine a line of best...
