Curated OER
Relating Space and Plane Shapes
In this mathematics worksheet, 1st graders identify which object in an illustration has a flat side the same shape as the box shown. Then they look at other shapes and identify the ones with a flat side, if any.
Curated OER
Minutes and Hours
In this mathematics worksheet, 1st graders identify about how long it takes to do each task illustrated. Then they do three things that take minutes to complete and three things that take hours to complete.
Curated OER
Extending Patterns
In this mathematics worksheet, 1st graders draw the shapes that they see in the pattern illustrated. Then they identify which shape comes first, which comes after the circle, and which comes after the square. Students also draw the shape...
Curated OER
Comparing Fractions (A)
In this mathematics instructional activity, students use an inequality sign or an equal sign to compare each of the fractions illustrated on the sheet. There are ten problems to solve.
Curated OER
Area and dimensions
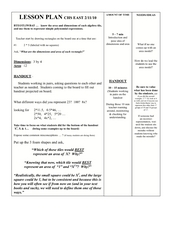
Sixth graders study the concepts of area and dimensions. In this area and dimensions lesson, 6th graders work in pairs to complete the handout included that illustrates ways to represent various numbers. Students also determine what...
Curated OER
The Commutative Cookie
Third graders investigate the commutative properties of multiplication and focus upon the setting of cubes in the correct patterns to solve problems. They differentiate between numbers that have multiple factors and prime numbers....
Curated OER
Rational Numbers
In this Algebra I worksheet, 9th graders identify properties from the real number system and use the distributive property to collect simplify expressions with parentheses. The one page interactive worksheet contains five multiple...
Curated OER
The Distributive Property
In this distributive property worksheet, students solve and complete 12 different problems that include using the distributive property to solve. First, they name the coefficient of each terms and list the like terms. Then, students use...
Curated OER
Discovering Math Concepts in Advanced Algebra
Students explore the concept of Chinese contributions in mathematics. For this Chinese contributions in mathematics lesson, students research Chinese achievements in mathematics. Students solve 3x3 systems of equations using the method...
Curated OER
On Our Way to School
First graders create a class graph that illustrates how they get to school and interpret data from the graph. They complete an assessment worksheet independently and answer questions about the graph shown.
Curated OER
Lesson 3: Lobster Roll!
Students play a game that illustrates the delicate ecological balance between fishing, fishing regulations and fish populations. They collect data and analyze the results.
Curated OER
Measurement: Lesson 2
Eighth graders complete math problems given in this lesson, where they find the perimeter and area of specific figures. They estimate the perimeter and area of shapes and figures and then complete the mathematical formula to find the...
Curated OER
Name Count and Graph
Students find the frequency of a name in selected states by using the Internet. They input data into a spread sheet. They create a graph that illustrates the gathered information.
Curated OER
Picture the Problem
Students create an illustration of how to solve math problems. They use appropriate resources for solving the problems. Students have to demonstrate how drawing diagrams and using pictures can help them by using KidPix. On Slide One,...
Curated OER
Illustrate Inequalities
Sixth graders participate in a lesson that involves the concept of inequalities. They translate the words of problems and put them into a visual illustration. The illustration should include a number line for assessment.
Curated OER
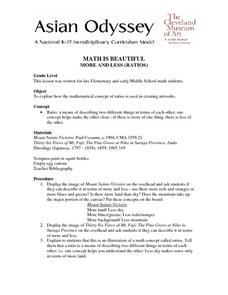
MATH IS BEAUTIFUL: More And Less
Students use tempura paints and mixing techniques to explore the mathematical concept of ratios in this cross-curricular late-elementary/ealy middle level Math lesson. A homework assignment is included.
EngageNY
End-of-Module Assessment Task - Geometry (module 1)
Have you hit a wall when trying to create performance task questions? Several open-ended response questions require a deep level of thinking. Topics include triangle congruence, quadrilaterals, special segments, constructions, and...
EngageNY
Overcoming a Third Obstacle to Factoring— What If There Are No Real Number Solutions?
Time for pupils to use their imagination! Learners examine the relationship between a system with no real solution and its graph. They then verify their discoveries with algebra.
EngageNY
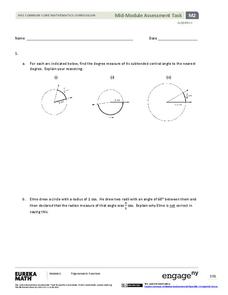
Algebra II Module 2: Mid-Module Assessment
Time for classes to show what they've learned. Use several tasks to assess understanding of the trigonometric functions, unit circle, radians, and basic trigonometric identities.
EngageNY
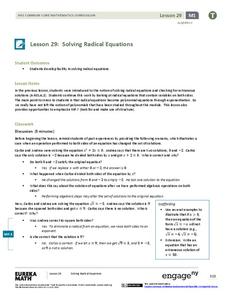
Solving Radical Equations
Learners solve complex radical equations. Solutions vary from one, two, and none, allowing pupils to gain experience solving a variety of problems.
EngageNY
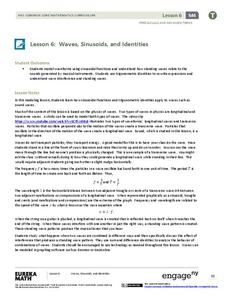
Waves, Sinusoids, and Identities
What is the net effect when two waves interfere with each other? The lesson plan answers this question by helping the class visualize waves through graphing. Pupils graph individual waves and determine the effect of the interference...
EngageNY
Converting Repeating Decimals to Fractions
Develop a process with your classes for converting repeating decimals to fractions. Through this process, pupils understand that any repeating decimal can be written as a fraction. The 10th activity in this 25-part module helps...
EngageNY
Understanding Variability When Estimating a Population Proportion
Estimate the proportion in a population using sampling. The 20th installment in a series of 25 introduces how to determine proportions of categorical data within a population. Groups take random samples from a bag of cubes to determine...
EngageNY
Creating a Histogram
Display data over a larger interval. The fourth segment in a 22-part unit introduces histograms and plotting data within intervals to the class. Pupils create frequency tables with predefined intervals to build histograms. They describe...


