Curated OER
LRO Sees Apollo 11 on the Moon!
In this moon image worksheet, students determine the scale of an image taken by the LRO satellite of the Apollo 11 landing site. Students calculate the sun's angle at the time of the photograph using the shadow of the Lunar Lading...
Curated OER
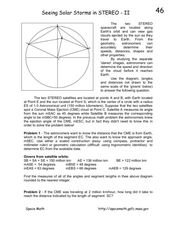
Seeing Solar Storms in STEREO-II
In this solar storms worksheet, students use a diagram given the location of two STEREO spacecraft satellites, a coronal mass ejection, the sun and the Earth to solve 2 problems about the coronal mass ejection. Students use segments,...
Curated OER
A Bird's Eye View Of Your Community
Learners locate and identify their community by using a satellite image from the Internet. Students locate and identify common land structures within their community. You may want to include structures such as roads/streets, houses and...
Curated OER
IBEX Uses Fast-Moving Atoms to Map the Sky!
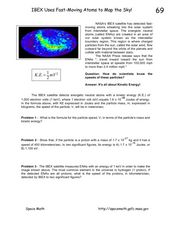
For this energetic neutral atoms worksheet, students solve 3 problems including determining the formula for particle speed, writing the equation to show the relationship between mass, energy and speed and determining the speed of protons...
Curated OER
Changing Perspectives on the Sun's Diameter
In this sun's diameter worksheet, students use a photograph taken by the SOHO satellite of the sun showing a change in diameter from one month to another. Students find the average diameter of the sun, they determine the percent change...
Curated OER
A Star Sheds a Comet Tail!
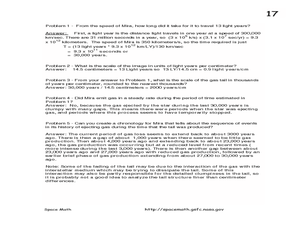
In this comet tails and stars worksheet, students read about the star Mira and the vast clouds of gases it emits. They use a photograph from the Galaxy Evolution Explorer satellite to solve 5 problems about the scale of the image, the...
Curated OER
Hinode Sees Mysterious Solar Micro-Flares
In this solar micro-flares instructional activity, students read about the X-ray bright spots that the Hinode satellite's X-ray Telescope detected on the sun's surface. Students determine the scale of the image, the dimensions of the...
Curated OER
How Big is a Lunar Crater?
For this lunar crater worksheet, learners use an image taken by the Lunar Orbiter spacecraft to find the scale of the image and determine the diameter of the lunar crater Tycho. They also find the size of the smallest and largest...
Curated OER
Google Earth Scavenger Hunt
Students complete activities to learn how to use Google Earth and study Alaska. In this Google Earth lesson, students complete a Google Earth scavenger hunt to find facts about Alaska. Students complete two worksheets for the topic.
Curated OER
Processing Satellite Images
Students comprehend the meaning of "pixel." They recognize patterns using pixels. Students observe how land use can be determined from a pixel. They measure off a 30 x 30-meter area to show the size of the surface area of one pixel....
NOAA
Earth Origami
After reading a brief history of Carl Skalak's journey on the open waters, scholars make a three-dimensional model of the Earth out of an Origami balloon using a printable decorated as the Earth.
Curated OER
Surface Air Temperature Trends of the Caribbean
Students use real satellite data to determine the changes in near-surface air temperature at different times of the year over the Caribbean Sea. They discover how Earth's tilt causes seasonal differences in incoming solar energy. They...
Midnight Martian
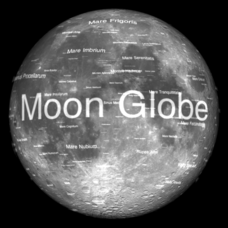
Moon Globe
Not just a simple globe of the moon, this interactive version allows you to choose lighting according to the location of the sun, views from different positions on Earth, and more! Satellite images and topographic data have been combined...
Curated OER
Aruba Cloud Cover Measured by Satellite
Young scholars analyze cloud cover over Aruba. They compose and submit written conclusions which include data, analysis, errors in data collection, and references.
Curated OER
Do You Have Change?
Students analyze data and complete a worksheet about land use change in a coastal region. In this land use lesson plan, students discuss events that cause land use changes in coastal areas. They construct a change table to summarize data...
Curated OER
Birds on the Move
Students observe the migrational path of the Swainson's Hawk from northern Minnesota to the southern portion of South America. They study the migratory path of the hawk and observe how the vegetation in a particular region of the earth...
Curated OER
Sequencing From Close To Far
Students explore how objects stay the same size and only "look" like they change when closer are farther from the object. They sequence aerial photos and satellite images from closest to farthest.
Curated OER
Scientist Tracking Network
Students correlate surface radiation with mean surface temperature of several geographic regions. They observe how these parameters change with latitude and construct an understanding of the relationship of solar radiation to seasonal...
Curated OER
This Dynamic Earth: The Story of Plate Tectonics
Discuss Earth's tectonic plates at middle school level with an informative presentation. Packed with maps, satellite images, diagrams, and photographs, the slideshow connects with any curriculum focused on plate tectonics. It...
Curated OER
Hawk in Flight
Students use information gathered by satellites to explore the migration of the Swainson's hawk from the western border of Minnesota to the southern portion of South America.
Curated OER
How Much Water is Available in the Atmosphere for Precipitation?
Students explore the relationship between the amount of water in the atmosphere available for precipitation and the actual precipitation observed by satellite. They examine seasonal changes in precipitation. They practice using Internet...
Curated OER
Playground Mapping
Students convert their physical models of a playground from a previous lesson into a map of the playground that includes a scale and key. They examine and discuss examples of maps, view an image to map photo essay, and create a map using...
NASA
Space-Based Astronomy on the Internet
Young scientists compile everything they have learned into a report in the fifth and final lesson in a unit on the visible light spectrum. Access to photos from observatories, telescopes, and satellites allows learners to compare...
Curated OER
Coral Bleaching in the Caribbean
Students practice analyzing images, maps and graphs from Internet-based educational resources. They explore the correlation between sea surface temperature and coral bleaching. Students comprehend that coral reefs are collections of tiny...

