Balanced Assessment
Survey Says
Examine statistical data that shows an overlap in responses. The data tallies over 100% and learners interpret this data characteristic. They then create a graph to represent the data.
Computer Science Unplugged
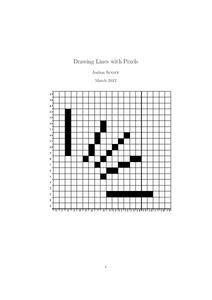
Drawing Lines with Pixels
How do the computers keep it straight? Using the provided algorithms, class members draw a line and a circle using pixels. They then check the drawings using a straight edge and compass to determine the accuracy of their...
Curated OER
Graphing Game
Students explore the concept of graphing ordered pairs. In this graphing ordered pairs lesson plan, students work in teams to play a version of Connect 4. Students use a Cartesian grid with values -4 to 4 as their Connect 4 board....
Curated OER
Graphing Linear Equations on the TI
Students graph linear equations on the TI calculator. In this algebra lesson, students rewrite equations in the slope intercept form and use the calculator to graph their problem. They work together to interpret the graphs off of the TI.
Curated OER
Inequalities
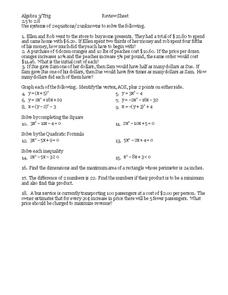
For this inequalities worksheet, 9th graders solve and complete 18 different types of problems. First, they use systems of 2 equations/2 unknowns to solve each word problem shown. Then, students graph each and identify the vertex plus 2...
Curated OER
Make a Pass at Me
Students identify different types of functions and units of measurements. In this statistics lesson, students will collect data, graph their data and make predictions about their data. They plot a linear regression graph.
Curated OER
How Many People Live in Your Household?
Students create a pictograph showing household size for the class.In this data collection and graphing lesson, the teacher guides students through the creation of a concrete object graph, then students analyze and summarize the results.
Curated OER
Away We Go!
Students study types of transportation. In this transportation lesson, students survey several classes to gather data on how they get to school. Students create a transportation graph.
Curated OER
“My Little Sister Hugged An Ape” | Literature, Math, & More!
Students read the story "My Little Sister Hugged An Ape" and make a list of sensory words from the story. In this interdisciplinary math lesson, students participate in sensory writing, and complete a questionnaire which they will use to...
Curated OER
Practice with Systems of Equations
Students solve systems of inequalities. For this algebra lesson, students solve a system of equation, using substitution, linear combinations and graphing. They identify the number of solution each system produce as infinitely many,...
Curated OER
Ordering Rational Numbers and Finding Their Approximate
Middle schoolers explore the concept of ordering rational numbers on a number line. They represent rational numbers as decimals and percents. Pupils create a foldable about converting fractions to decimals to percents, and use a...
Curated OER
Linear and Exponential Functions
This comprehensive unit on linear and exponential functions provides numerous clearly-written worksheets. Topics include graphing linear equations, solving systems of equations algebraically and by graphing, identifying the domain and...
The New York Times
Fiction or Nonfiction? Considering the Common Core's Emphasis on Informational Text
Nothing aids in comprehension more than an explanation and understanding of why things are done. Address why the Common Core requires the reading percentages that it established and analyze how this affects your readers. Learners read...
Curated OER
Complex Roots: A Graphical Solution
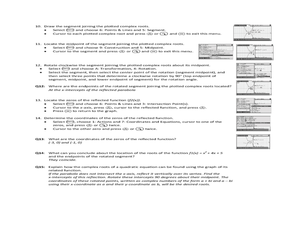
Using their Ti-Nspire to determine the solutions of parabolas, high schoolers explore the concept of complex roots. Students determine if parabolas have real or complex roots. High schoolers determine the the axis of symmetry...
Curated OER
Further Differentiation
In this further differentiation worksheet, students solve and complete 7 various types of problems. First, they sketch the graph of each equation using a stationary point. Then, students find the stationary points of each and describe...
Pennsylvania Department of Education
Freckle Face
Students collect and record data. In this early data analysis lesson, students gather data about their partners face. As a class, the students use tally marks and pictographs to record the data and answer question about the information...
Curated OER
Frequency Tables and Stem-and-Leaf Plots
Students are introduced to the function of frequency tables and stem and leaf plots. In groups, they determine the frequency of their teacher coughing, ringing a bell or raising their hand. To end the lesson, they determine frequency...
Virginia Department of Education
Algebra Tiles and Solving Equations
Young mathematicians solve linear equations by drawing models of algebra tiles using colored pencils. To finish, they solve the same equations algebraically and check their answers using a graphing calculator.
Virginia Department of Education
Road Trip
Help plan a road trip with linear equations. Scholars consider two different rental car companies and write equations representing the cost for each company. They graph the system of equations to determine the conditions under which each...
Curated OER
Systems of Equations: What Method Do You Prefer?
Young scholars explore the concept of solving systems of equations. In this solving systems of equations lesson, students watch YouTube videos about how to solve systems by graphing and by elimination. Young scholars use an interactive...
Los Angeles County Office of Education
Assessment For The California Mathematics Standards Grade 4
Have scholars show what they know with a 20-page assessment aligned to the California State Standards. The test covers concepts such as large and whole numbers, all four mathematical operations, fractions, decimals, geometric figures,...
Curated OER
Practice: Word Problems
Congratulations, you've just hit the word problem jackpot! Covering an incredible range of topics from integers and fractions, to percents, geometry, and much more, this collection of worksheets will keep young mathematicians...
Curated OER
College Education
What do Bill Gates and Mark Zuckerberg have in common? They're both billionaires, and neither one has a college degree! Using the website, scholars explore whether having a college education is truly worth the money it costs. They read...
Michigan Sea Grant
Water Quantity
It may be tricky for a young mind to conceptualize that less than 1% of all water on earth is useable for humans to drink. Simulating the amount of fresh water available on earth by removing measured amounts of water from a five-gallon...

