Curated OER
Pancakes, Anyone?
First graders explore data collecting and graphing. In this data collecting and graping lesson, 1st graders watch a video about monster who sells pancakes. Students make a graph to record the most popular pancake. Students also play...
Curated OER
Solving Systems of Equations
Learners identify the quadrants and axis of a coordinate plane. In this algebra lesson, students discover the ocrrect way to graph using the coordinate plane. They discuss the relationship between x and y values, domain and range and...
Curated OER
How Does Your KinderGarden Grow
Learners find forecast and graph weather by using WeatherBug site, create flower books by using Wiggleworks, and plant radish seeds both on KidPix and in class garden.
Curated OER
Building a Dream House
Tenth graders explore how to use basic geometry and calculation skills to design their dream house. They use calculation to design the home and estimate the price within a budget of $150,000.
Curated OER
Fin, Feathers, or Fur?
Students learn how to classify animals. In this animal characteristics lesson, students read Granddad's Animal Alphabet Book, brainstorm a list of different kinds of animals, and determine their characteristics; fur, feathers or scales....
Curated OER
Cramer's Rule ID: 8793
Mathematicians are introduced to Cramer’s Rule and use it to solve three systems that have one solution, no solutions, and an infinite number of solutions. High schoolers use TI-Nspire to graph the systems to verify their answers...
Curated OER
Frog and Toad are Friends
Students view a 30-minute video lesson to discover information about the characteristics of frogs and toads. They then transform themselves into frogs and participate in a Jumping Frog Jubilee. They work in groups of three to measure and...
Alabama Learning Exchange
The Grouchy Ladybug
Students listen to the book, "The Grouchy Ladybug" by Eric Carle and sequence the events in the story. Using a graph, they draw and color the animals that the ladybug meets next to the corresponding time from the story, and conduct...
Curated OER
Coordinate Connections
Sixth graders complete several activities that involve coordinates and graph paper. They visualize and identify geometric shapes after applying transformations on a coordinate plane. Finally, 6th graders draw and label a coordinate...
Curated OER
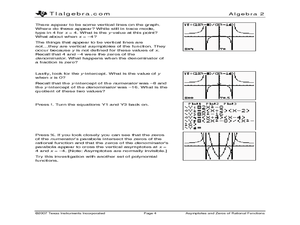
Asymptotes and Zeros
Learn how to explore rational functions and investigate the graphs rational functions and identify its singularities and asymptotes. Students approximate the solutions to rational equations and inequalities by graphing.
Curated OER
Nutrients by the Numbers
Students read and discuss an article on the amount of sugar in various food products. They compare the nutritional values of food products, calculate their daily intake of nutrients, analyze serving sizes, and compare/contrast their own...
Curated OER
How Texas is Planning To Manage Its Water
Learners research water management strategies in Texas. They analyze projected demand for water in the year 2050, interpret graphs and tables and then discuss the data as part of a written report. They research and map the locations of...
Curated OER
Infusing Equity in the Classroom by Gender
Students investigate the idea of gender descrimination in the classroom. In this algebra lesson, students collect data in stereotyping, and gender bias in the classroom, school materials and activities. They graph and analyze their...
Curated OER
Science as Inquiry: what is starch and how can we test it?
Sixth graders discuss nutrients and examine foods for starch. For this starch testing lesson, 6th graders use iodine to test foods for starch and record their results. Students complete a worksheet and self reflection.
Curated OER
Sharing Our Knowledge
Students evaluate their participation in an animal welfare service project. In this animal welfare lesson, students reflect upon their experience by using their feelings and descriptions in their writing. Students share their experiences.
Curated OER
AC Phase
In this AC phase worksheet, students answer 24 questions about AC and DC voltages, phasor diagrams, sine wave graphs and Lissajous figures.
Curated OER
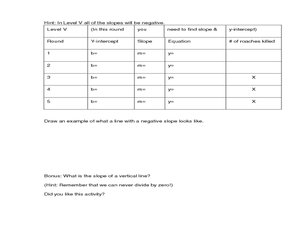
Cockroach Slope
Students identify the slope of linear functions. In this slope lesson, students collect data and graph it. They write equations with no more than two variables and use technology to explain their data.
Curated OER
Giving it 100%
Students build knowledge about the number relationships between decimals and percents as it relates to converting decimals into percents. In this decimal and percent lesson, students recognize equivalent forms of fractions,...
Curated OER
Linear Systems and Calories
Students define and graph properties of linear equations. In this algebra lesson plan, students write systems of equations to represent functions. They relate linear equations to the real world.
Curated OER
What Kind of Santa Claus You Are.
Students use a photograph analysis sheet to analyze primary sources (photographs) of the Great Depression in small groups. They then write a poem about kids in the Depression Era that reflects their comprehension of the period and...
Curated OER
Factoring Trinomials
Students factor trinomials using algebra tiles and blocks. In this algebra lesson plan, students complete a trinomials station activity. They work backwords to find their answers and discuss their steps in a group.
Curated OER
Body Voyager
Students explore the significance of a resting and an active heart rate. In this heart lesson students chart data on their pulse and draw a diagram of the heart.
Curated OER
Solving Systems using Elimination
Using elimination to find the point of intersection of two lines, students learn to solve systems of equation. They graph their solutions and use the TI to verify the solution.
Curated OER
Coin Lab
In this experimental design learning exercise, students experiment with three coins, a dropper and water. They determine how many drops of water they can put on each coin. They answer questions about their experiment and they design an...

