GeoGebra
GeoGebra Graphing Calculator
So, exactly, what does it look like? The easily usable graphing calculator allows pupils to visualize the graph of equations and inequalities. The interactive supports any algebraic graph needed for high school mathematics and then some.
Desmos
Desmos Graphing Calculator
They say a graph is worth a thousand points. The interactive allows users to graph a wide variety of functions and equations. Using the included keyboard or typing directly into the list, learners determine the graph of a function....
CK-12 Foundation
Single Bar Graphs: Cupcakes
What is a little cake among friends? Given the relationship between the number of cupcakes five friends have, pupils create a bar graph. The learners answer questions about the graph and adjust the graph if one friend shares some of his...
Shodor Education Foundation
Linear Inequalities
An interactive lesson helps individuals learn to graph inequalities in two variables. Scholars can adjust the interactive to present the inequalities in standard or slope-intercept form.
CK-12 Foundation
Graphs of Systems of Linear Inequalities in Two Variables: President Jefferson's Octagonal Home
Mathematically complete a set of blueprints. Using eight linear inequalities, pupils create a blueprint of Thomas Jefferson's home. Individuals graph the linear inequalities and position the solution of the inequalities before...
CK-12 Foundation
Linear Inequalities in Two Variables
Take the tediousness out of finding solutions of inequalities by graphing. Individuals use an interactive that allows them to adjust a system of inequalities on a coordinate plane. Using the interactive helps find solutions to systems of...
CK-12 Foundation
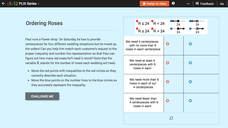
Checking Solutions to Inequalities: Ordering Roses
It's important to have the correct number of flower arrangements at a wedding. Scholars match an inequality and a graph given a situation involving roses for wedding receptions. A set of challenge questions checks the matching pairs.
CK-12 Foundation
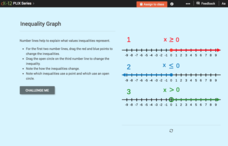
Inequality Expressions: Inequality Graph
Don't let inequalities be a drag. As young mathematicians drag the endpoint of the graph of an inequality in an interactive, the algebraic form of the inequality changes. This helps them see how the graph connects to the inequality.
CK-12 Foundation
Checking Solutions to Inequalities: Apples and Bananas Shopping Excursion
Go bananas over a fun interactive! Learners drag a point on a virtual graph of an inequality to see if it is a solution. This helps determine the possible numbers of apples and bananas a shopper can buy with a given amount of money.
CK-12 Foundation
Systems of Linear Inequalities: Baking Cookies
Cook up a good resource for systems of linear inequalities. Using an interactive, individuals graph a system of linear inequalities to represent constraints on the number of cookies a person must bake. A set of challenge questions...
Curated OER
Systems of Linear Inequalities
In this Algebra I/Algebra II worksheet, students solve systems of linear inequalities by graphing the inequalities on a coordinate plane and determining the location of all ordered pairs that solve the system. The three page...
Curated OER
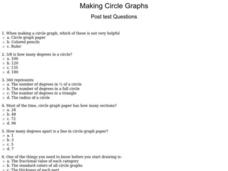
Making Circle Graphs
In this circle graphs worksheet, students answer multiple choice questions about how to make circle graphs. Students answer 10 questions total.
Curated OER
Review of Algebra I
Test your class with this online review. They determine the probability of a given situation, solve inequalities, systems of equations, and write numbers in scientific notation. This two-page worksheet contains approximately 60...
CK-12 Foundation
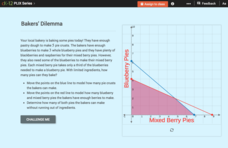
Linear Programming: Bakers' Dilemma
Place the pies in a line. Pupils create a graph of a system of linear inequalities to represent the number of pies a bakery can make. Learners analyze the vertices on the graph to determine the number of pies they can bake without...
CK-12 Foundation
Cliff Diver
Cliff diving is more than an adrenaline rush ... it's a lesson in physics! Scholars adjust the height of a cliff and plot the resulting velocity and position over time on graphs. They also can incorporate air resistance to monitor the...
CK-12 Foundation
Types of Data Representation: Baby Due Date Histogram
Histograms are likely to give birth to a variety of conclusions. Given the likelihood a woman is to give birth after a certain number of weeks, pupils create a histogram. The scholars use the histogram to analyze the data and answer...
CK-12 Foundation
See Saw
Can a mother who weighs five times more than her child really be held in the air on a see saw by the child? A simple simulation demonstrates how this is possible through altering the distance from the fulcrum. Scholars can adjust the...
Curated OER
Pictures of Data: Post Test
In this data worksheet, students answer multiple choice questions about charts and graphs. Students answer 10 questions total.
Curated OER
Word Problems
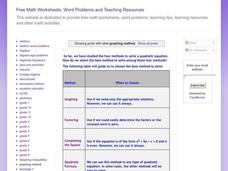
In this algebra worksheet, students are guided to choose the best method to solve problems using graphing, factoring, completing the square, and quadratic formula. There are 4 problems with an answer key.
CK-12 Foundation
Archery
Archery is believed to be one of the oldest sports in the world at more than 25,000 years old—meaning it can teach your classes a lot! Scholars learn about the forces interacting in the archery simulation. They control the archer's...
CK-12 Foundation
Block and Tackle
Can you easily lift more than your own weight? With a pulley system, almost anyone can manage this challenge. Scholars adjust the mechanical advantage (number of pulleys), weight of object being lifted, and the length of rope pulled. The...
CK-12 Foundation
Newton's Cannon
Gravity does more than keep our feet on the ground — it holds a satellite in orbit, too. Help learners understand the effects of gravity on an orbiting object through a simulation activity. Individuals adjust a launch speed and watch as...
Curated OER
Selecting the Best Method for Solving Quadratic Equations
In this solving quadratic equations worksheet, students select the best method to solve a quadratic equation and then solve five quadratics. Fully worked examples are provided.
Curated OER
AC Phase
In this AC phase worksheet, students answer 24 questions about AC and DC voltages, phasor diagrams, sine wave graphs and Lissajous figures.
Other popular searches
- Graphing Linear Inequalities
- Graphing Inequalities
- Math Graphing Inequalities
- Graphing Compound Inequalities
- Algebra Graphing Inequalities


