Achieve
Rabbit Food
Keep your pets slim, trim, and healthy using mathematics! Pupils use a linear programming model to optimize the amount and type of food to provide to a pet rabbit. They model constraints by graphing inequalities and use them to analyze a...
Howard County Schools
Building a Playground
Scholars crave practical application. Let them use the different models of a quadratic function to plan the size and shape of a school playground. They convert between the different forms and maximize area.
Achieve
Task: Storage Sheds
Bridge the gap between mathematics and Career Technical Education. Pupils research the cost associated with building storage sheds and analyze possible profit. They build scale models and determine if building and selling the sheds is a...
Kenan Fellows
Isotopic Pennies
Many people confuse atomic mass and atomic numbers. The sixth of seven lessons in a unit requires scholars to find the weight of different groups of pennies. Then, they must solve how many of each type of penny exists in a closed system...
National Research Center for Career and Technical Education
Health Science: Back to Basics
This lesson focuses on unit conversion, proportions, ratios, exponents, and the metric system. Discuss measurement with your math class and demonstrate how to solve several health-science word problems. Give learners a chance to visit an...
Curated OER
Weather Watchers
Students are introduced to an Underground Weather Stations. In groups, they use the internet to research the weather in different parts of the United States locating each city. To end the lesson, they summarize the information they...
Georgia Department of Education
The Basketball Star
Have learners use math to prove they are sports stars! Assess a pupil's ability to create and analyze data using a variety of graphs. The class will be motivated by the association of math and basketball data.
Curated OER
Less is More: Realizing Mathematics Through Agriculture
High schoolers study the architectural designs of different popular sites. In this math lesson, students draw a grid diagram. They explain what geodesic algorithms are used for.
Curated OER
Measure and Measure
Students use video integration to help them learn about non-standard measurements. In this measurements lesson, students watch a video about measurement. Students determine which non-standard measurement unit would be best to solve the...
Curated OER
Integrating the Craft of Writing into Physical Education
Incorporate writing into your physical education class. In groups, learners unscramble a list of words related to exercise and use them in their journal writings. Using their name, they write one word related to physical activity that...
Curated OER
Technology Integration Project Weather Unit Plan
Learners use a variety of technology-assisted weather observation tools to observe and record local weather. They identify, measure and record weather conditions, summarize types of clouds and make graphs of their observations. Students...
Center for Mathematics and Technology
Whole Numbers: Using an Area Model to Explain Multiplication
There are many ways to work through a multiplication problem. Using an area model, kids complete several worksheets with different types of multiplication problems, including multiplying by ten, and explain how the new strategies differ...
Baylor College
Needs of Plants
What better way to learn about plant life than by creating a class garden? Young botanists start with a brief discussion about radishes before planting seeds and watching them grow. To determine the importance of water,...
Curated OER
The Game is Afoot - A Study of Sherlock Holmes
Mystery is an exciting genre for young readers to investigate. The plots are so intriguing! Here is a series of lessons featuring Sherlock Holmes stories that invite learners to enter the world of the mystery genre. Based on what...
Federal Reserve Bank
Lesson 4: Back to School
Based on your current level of human capital, how long would it take you to earn $1,000,000? What about your potential human capital? Learners explore the importance of education and experience when entering the workforce, and compare...
EngageNY
Analyzing Data Collected on Two Variables
Assign an interactive poster activity to assess your class's knowledge and skill concerning data analysis. The teacher reference provides solid questions to ask individuals or groups as they complete their posters.
West Contra Costa Unified School District
Factoring Quadratic Expressions
Factor in different strategies in a lesson for factoring quadratics. Young mathematicians first create tables and area models to factor quadratic trinomials into two binomials by guess and check. Learners then investigate how they can...
National Security Agency
Multiple Representations of Limits
After an introductory activity to demonstrate the theory of a limit, additional activities approach a limit from graphical, numerical, and algebraic methods. The activity looks at the multiple ways of understanding and evaluating a...
Mathematics Vision Project
Module 1: Getting Ready Module
This fabulous resource is a must-have for any algebra teacher's arsenal of lessons. Developing the idea of equations and use of variables from basic physical scenarios, learners gain valuable intuition in the structure and meaning of...
West Contra Costa Unified School District
Correlation and Line of Best Fit
Computers are useful for more than just surfing the Internet. Pupils first investigate scatter plots and estimate correlation coefficients. Next, they use Microsoft Excel to create scatter plots and determine correlation...
Fort Bend Independent School District
Data Analysis - AP Statistics
What better way to study survey design than to design your own survey! Bring a versatile data analysis project to your AP Statistics class, and encourage them to apply the practices from their instructions to a real-world survey...
Shodor Education Foundation
Algebra Quiz
Reviewing the process of solving equations is as easy as one click of a button. Scholars solve linear and quadratic equations by using a helpful interactive. The computer app automatically scores responses, providing immediate feedback...
Shodor Education Foundation
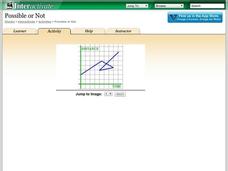
Possible or Not?
What does the graph mean? Pupils view 10 graphs and determine whether they are possible based on their contexts. The contexts are distance versus time and profit versus time.
Curated OER
Integrating Mathematical Concepts in the Study of the Atmosphere and the Ocean
Students utilize problem solving strategies that emphasis writing in mathematics, and strategies that have students make decisions and draw conclusions. They connect math to weather and climate topics.


