Curated OER
50 States: New England States
Students discover where certain states are located and what the look like. They look for their information on a web site. Each student is assigned a state which they must research then present to the entire class.
Curated OER
Japanese Religion (Shinto)
Fifth graders explore the relationship between the early Japanese religion of Shinto and the natural phenomena of Japan. They engage in Day 3 of the Warlords of Japan simulation.
Curated OER
Barrier Islands
Third graders explore how barrier islands work. In this erosion lesson, 3rd graders create barrier islands in stream tables and simulate wave action to see how it affects their island.
Curated OER
Here Today, Gone Tomorrow
Young scholars explore erosion. Through multi-media and hands-on activities, students identify the effects of wave erosion and hurricanes on a barrier island. Young scholars watch a video and create a cause and effect chart of their...
Curated OER
Mountain Pine Beetles
Students research and develop power point presentations that answer the question, "What is changing our forests?" In this ecology lesson, students research the niche of Pine Beetles and their increased effect on the forests in...
Curated OER
Zoo Poo
Students use Internet research to determine the amount of carbon dioxide produced per unit energy for biomass and coal. In this alternative energy lesson, students research to find out how much energy and carbon dioxide several coal and...
Curated OER
The Sun Affects Earth
Third graders read, write, and listen to information about the sun and its effects on the Earth.as it relates to its axis, orbit, rotate, and revolution. In this solar system lesson, 3rd graders examine how the sun...
Curated OER
The Lake Effect
Fourth graders conduct an experiment demonstrating the effects of water and air temperature on precipitation. They create graphs demonstrating their findings using Claris Works for Kids.
Curated OER
What Makes you Hot?
Students manipulate different variables in a model and make inferences about the temperature on Earth. In this heat lesson students calculate the blackbody radiation of an object at a certain temperature.
Curated OER
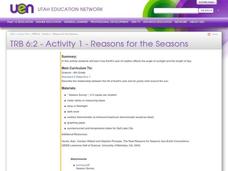
Reasons for the Seasons
Students discover how the Earth's axis of rotation affects the angle of sunlight and the length of day. They take a survey and give the survey out to family members and friends. They tally their findings and then determine the correct...
Curated OER
Trouble in the Troposphere
Young scholars create graphs using NASA data, compare ozone levels of several U.S. cities, analyze and evaluate the data and predict trends based on the data, and discuss and describe how human activities have modified Earth's air quality.
Curated OER
The Twelve Months: A Slavic Cinderella Variant
Students locate Slavic countries and identify a few characteristics of those countries. They read and/or listen to the Slavic tale, "The Twelve Months," and compare this version with another Cinderella story.
Curated OER
Reasons for the Seasons
Sixth graders conduct and analyze a survey that explores public perceptions about the reasons for seasonal change. They measure the changing length of days, observe shadows and discuss how the Earth's axis of rotation affects the seasons.
Curated OER
Does Humidity Affect Cloud Formation?
Middle schoolers use NASA's S'COOL database to identify factors that affect cloud formation.
Curated OER
Scientific Graphs
Students organize data collected from their experiments using graphs. In this statistics and biology lesson, students organize their scientific data from an article into readable graphs. They define the usefulness of their graph and...
Curated OER
Trouble in the Troposphere
Students Use data sets from MY NASA DATA to produce graphs comparing monthly and yearly ozone averages of several U.S. cities. They analyze and evaluate the data and predict trends based on the data. In addition, they discuss and...
Curated OER
What Do We Know About Africa?
First graders explore Africa, its geography and climate. After completing a KWL chart, 1st graders locate Africa on a globe and discuss how its location on the earth affects its climate. Using the Internet and a given fact sheet,...
Curated OER
Earthweek
Students explore the ongoing changes in the relationship between human beings and their physical world. They read articles on environmental changes. Students write a short analysis of the effect of the event on the residents of the area...
Curated OER
Science: Trouble in the Troposphere
Students research a NASA Website and record information about an assigned city's tropospheric ozone residual monthly climate. In groups, they graph the information for the past year. They form new groups and compare their city's...
TeachEngineering
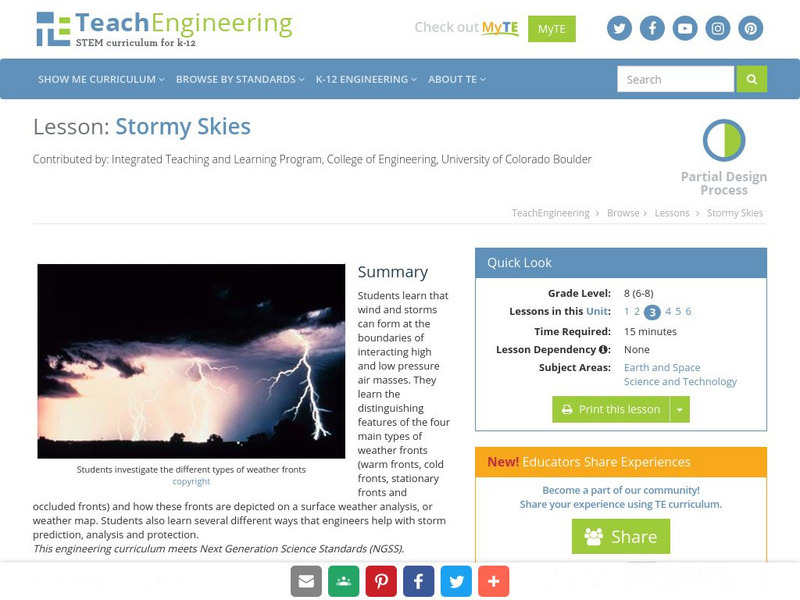
Teach Engineering: Stormy Skies
Students learn that wind and storms can form at the boundaries of interacting high and low pressure air masses. They learn the distinguishing features of the four main types of weather fronts (warm fronts, cold fronts, stationary fronts...


