Curated OER
Graphing Radical Functions-A Graphic Introduction
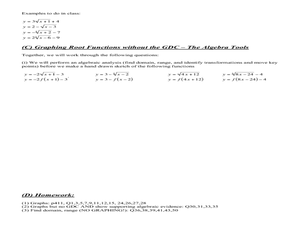
In this Algebra II worksheet, 11th graders graph root functions and analyze the domain, range, intercepts, maximum and minimum values, and end behavior. students use that information to transform the graphs of root functions. The three...
Curated OER
Rational Expressions Test with a Calculator
In this rational expression worksheet, students graph rational equations, evaluate limits, state intercepts, asymptotes, and roots and factor. This worksheet is designed as a test to be completed with a calculator.
Curated OER
Graphing Linear Equations on the TI
Students graph linear equations on the TI calculator. In this algebra lesson, students rewrite equations in the slope intercept form and use the calculator to graph their problem. They work together to interpret the graphs off of the TI.
Curated OER
Solving Systems of Linear Equations Graphically
Students solve systems of equations graphically. In this algebra lesson, students find the point of intersection of two lines if they are not parallel. They rewrite the equation in the y=mx + b form and graph using slope and intercept.
Curated OER
Graphing Linear Equations
Students graph linear equations. In this algebra lesson, students perform transformation on linear equations. They identify the slope and y-intercept of each line.
Virginia Department of Education
Transformationally Speaking
Young mathematicians explore transformations of graphs by graphing sets of functions on the same pair of axes. They use their graphs to determine the effect that the values of a and b in y = ax + b have on the graph of y = x.
CCSS Math Activities
Smarter Balanced Sample Items: 8th Grade Math – Target C
Target C from the Smarter Balanced assessment for eighth grade is understanding the connections between proportional relationships, lines, and linear equations. A slide show includes items about graphing proportional relationships and...
Texas Instraments
Angles in Circles
Teach your learners how to investigate the relationship between a central angle and an inscribed angle which subtend the same arc of a circle. The dynamic nature of Cabri Jr. provides opportunity for conjecture and verification.
Curated OER
Algebra 1, Unit 7, Lesson 8: Practice Finding the Equation of a Line
Students solve systems of linear equations by graphing. The introduction of the lesson asks students to work in pairs or small groups to graph a line when given two points. Students graph 14 equations on the same coordinate grid to...
Charleston School District
The Line of Best Fit
If it's warm, they will come! Learners find a line of best fit to show a relationship between temperature and beach visitors. Previous lessons in the series showed pupils how to create and find associations in scatter plots. Now, they...
CK-12 Foundation
Input-Output Tables for Function Rules
How does changing a graph affect the function? Learners watch the changing input-output table as they adjust the location of the line graph. Questions prompt them to complete a table of values and determine the function rule.
Mathed Up!
Drawing Quadratic Graphs
Curve through the points. The resource, created as a review for the General Certificate of Secondary Education Math test, gives scholars the opportunity to refresh their quadratic graphing skills. Pupils fill out function tables to find...
Curated OER
Slope and Equations of Lines
In this slope worksheet, students find the equation of a line given a pair of points or a given slope. Examples are provided at the beginning of this worksheet. There are 20 problems on this two-page worksheet.
Curated OER
Compare and Contrast
Students graph equations using the y-intercept. For this algebra lesson, students investigate functions based their slope and y-intercept. They learn to analyze graphs by comparing the y-intercepts of the graphs.
Curated OER
Extra Problems - Week 13 (Functions)
In this function instructional activity, students complete a variety of problems. They explore logarithms, find the y-intercept, identify the y-intercept, and complete distance problems. This seven-page instructional activity contains 30...
Curated OER
Graphing Linear Equations with Calculator
Students graph lines using the calculator. In this algebra lesson, students graph lines of equations in the form y=mx+b. They input equations into the TI Calculator and graph using the slope and intercept. They analyze the graph for...
Curated OER
Slope of a Function
Seventh graders explore the concept of the slope of a line. They see how to determine the direction of the line. Also students are introduced to the slope intercept algebraic expression in conjunction with the rise/run.
Curated OER
Lesson 4: Factoring to Solve Quadratic Equations
Students solve quadratic problems by factoring. Using a specified website, or an interactive CD-ROM, students graph quadratic equations. Together, on the computer, students work example problems. Students observe the link between...
Curated OER
Graphing Scatterplots
Students examine scatterplots and determine the equation of a line using the slope-intercept method. Students interpret graphs, draw inferences, and sketch a curve of best fit for the graph. Based upon patterns in the graphs, students...
Curated OER
Graphing Linear Equations Using Data Tables
Students review the Cartesian plane and the process of plotting points. In groups, students create tables, identify the slope and y-intercept, and graph the equation. Afterward, students perform the same process, only, individually. As a...
Curated OER
Linear Equations Data Tables
Students graph linear equations on a Cartesian plane. After describing data tables and their use, students explore how the information from a table can be used to create a line graph. They discuss reasons for plotting a minimum of...
Curated OER
Families of Functions
Young scholars investigate families of functions. In this families of functions lesson, students discuss how changing a functions parameters affect its' graph. Young scholars vary slope and y-intercepts of linear functions. Students...
Curated OER
Practice Exit Exam - Mat 0024
In this practice exit exam, students complete a variety of basic algebra problems on an Algebra I skill level. They simplify expressions containing variables, factor quadratic equations, find the slope of a line, identify the...
Curated OER
Graphing Linear Equations
In this math worksheet, middle schoolers practice graphing the solutions to the linear equations. They pay special attention to the slope and y intercepts.
Other popular searches
- Slope Intercept Form
- Slope and Y Intercept
- Slope Intercept
- Y Intercept
- X and Y Intercepts
- Slope Intercept Form
- X Intercept
- Y Intercepts
- Slope Intercept
- Slope Intercept Equation
- Slope and Y Intercept
- Writing Slope Intercept Form


