Curated OER
Viewpoints
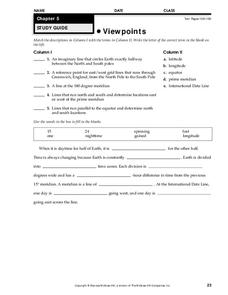
In this latitude and longitude worksheet, students complete 10 matching questions identifying key features or locations on a map. Students also use lines of latitude and longitude to identify the time in 4 different places.
NOAA
Ocean Exploration
Where am I? The second installment of a 23-part NOAA Enrichment in Marine sciences and Oceanography (NEMO) program starts with pupils guessing the years in which major ocean exploration events took place. The lesson then focuses on how...
Curated OER
Viewpoints
In this map worksheet, learners review latitude, longitude, equator, and prime meridian. This worksheet has 5 matching and 8 fill in the blank questions.
Curated OER
Time Zones
In this time zones worksheet, students are given a map of the Earth indicating the time zones, the prime meridian and the international date line. Students answer 5 questions about solar occurrences and determine when each would be seen...
Illustrative Mathematics
Growing Bean Plants (Grade 2)
After planting a bean seed in a jar, young scientists observe the growth patterns over several days. As the bean becomes a sprout, and the sprout becomes a plant, partners measure and plot the data. They notice patterns, practice...
Curated OER
Finding the Ages of Rocks and Fossils
Students practice dating fossils. They learn the concept of "deep time"--that earth was formed billions of years ago. They experience excellent hand-outs and virtual age tutorial links.
Curated OER
Investigating Latitude and Longitude
Students examine the lines of latitude and longitude on a map, and explain why these lines might be useful. In this lesson students also explore websites that provide information to improve their understanding of how and why latitude and...
Curated OER
Snow Cover by Latitude
Learners create graphs showing the amount of snow coverage at various points of latitude and compare graphs.
CPO Science
Science Worksheets
If you need an array of worksheets to augment your science lessons, peruse a collection of assignments that is sure to fit your needs. With topics such as metric conversion, the scientific method, textbook features, research skills,...
Curated OER
Comparison of Snow Cover on Different Continents
Pupils use the Live Access Server (LAS) to form maps and a numerical text file of snow cover for each continent on a particular date. They analyze the data for each map and corresponding text file to determine an estimate of snow cover...
Curated OER
Sponges
For this sponges worksheet, high schoolers will explore the characteristics of sponges including their different types of cells and body structures. Students will also determine how sponges reproduce. This worksheet has 3 short answer...
Curated OER
Snow Cover By Latitude
Students examine computerized data maps in order to create graphs of the amount of snowfall found at certain latitudes by date. Then they compare the graphs and the data they represent. Students present an analysis of the graphs.
Curated OER
Hurricane Research
Learners examine the factors that influence hurricanes to develop. In this hurricane lesson students research atmospheric trends that affect hurricanes and create a summary.
Virginia Department of Education
Hurricanes: An Environmental Concern
Hurricanes, typhoons, and tropical cyclones are the same type of storm, but their names change based on where they happen. Scholars use a computer simulation to learn about hurricanes. Then they hypothesize ideas to prevent hurricanes...
Curated OER
Plotting A Hurricane Using latitude and Longitude
Students explore map and plotting skills by tracing the movement s of hurricanes through the Earth's systems. a hurricane map is developed from daily media reports.
Curated OER
Hurricanes: An Environment of Concern
Students study hurricanes and research the damage done by hurricane Katrina. For this environment investigative lesson students divide into groups and complete a given assignment.
Alabama Learning Exchange
The Sun and the Earth
Third graders study and diagram the positions of the Earth and sun during the four seasons. They predict weather for cities in the northern and southern hemispheres.
Curated OER
Where in the Latitude Are You? A Longitude Here.
Students distinguish between latitude and longitude on the map. In this mapping lesson, students participate in mapping skills to recognize spatial relationships, and where to find natural resources on the map. Students create...
Curated OER
Time Zones and Migration Patterns of the Leatherback Sea Turtle
Young scholars identify the different time zones by plotting the migration patterns of the leatherback sea turtles. They discover that traveling around the worlds includes passage through different time zones.
Curated OER
Math with Maps and Globes
Students round out their math skills with these ‘round the world' ideas. In this math and geography lesson, students try out time zone sticks, a polar race, and tic-tac-globe to engage them in learning more about globes and the...
Cornell University
Who’s Got The Flu?
Become an immunologist for the day. Scholars elicit the use of the enzyme-linked immunoabsorbent assay (ELISA) to diagnose an infectious disease. Through the process, they learn about the immune system response to infectious diseases.
Curated OER
Unit VII Energy: WS 1 Qualitative Analysis - Pie Charts
For each of eight diagrams of objects in motion, physics masters draw pie charts to depict the changes in energy. For each they must identify the energy conditions at each position. This is a unique learning exercise, perfect for...
Curated OER
A Brand New Day
Learners locate Maine on a classroom map and discuss if Maine is where the nation's first light is found, where would the nation's last light be seen. They explore the idea of the sun rising in the east and setting in the west.
Curated OER
Snow Cover By Latitude
Students create graphs comparing the amount of snow cover along selected latitudes using data sets from a NASA website. They create a spreadsheet and a bar graph on the computer, and analyze the data.


