Radford University
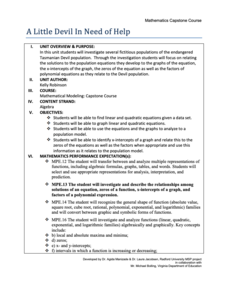
A Little Devil In Need of Help
Math modeling to help endangered species? Scholars first investigate linear and exponential equations and graphs that model fictitious animal populations. They consider how key features of the graphs relate to the situation. As a final...
EngageNY
Vectors in the Coordinate Plane
Examine the meaning and purpose of vectors. Use the activity to teach your classes how find the magnitude of a vector and what it represents graphically. Your pupils will also combine vectors to find a resultant vector and interpret its...
PBS
The Lowdown — What You Need to Know about Immigration Reform
We're all from somewhere. An informative interactive provides information on immigration, foreign-born residents, and deportations. Pupils interpret the graphics to analyze how these quantities have changed over time. The resource is...
Radford University
Plumbing Task
Make sure it flows smoothly. Pairs research plumbing codes to find the required slope for a sewer line. Using the information, groups answer several questions involving interpreting the slope. Pupils determine the cost of pipe to run a...
Flipped Math
Calculus AB/BC - Defining Limits and Using Limit Notation
There's no limit to what one can learn about limits. The second of 18 videos in Unit 1 - Limits and Continuity focuses on understanding the basic concept of a limit. Pupils learn the definition of limits and see how to determine a limit...
Illustrative Mathematics
Electoral College
A cross-curricular resource that takes the electoral votes and allows your learners to organize and analyze the data. Young voters can determine which states are more influential and interpret the dotplot provided for more data....
Chymist
The Solubility of a Salt in Water at Various Temperatures
An educational activity allows young chemists to test the solubility of different types of salt at various temperatures. Groups create a graph using data from unsaturated, saturated, and supersaturated solutions.
Polar Trec
Global Snow Cover Changes
Snow is actually translucent, reflecting light off its surface which creates its white appearance. Pairs or individuals access the given website and answer questions about snow cover. They analyze graphs and charts, examine data, and...
Chicago Botanic Garden
Historical Climate Cycles
Ice core samples give scientists access to climates of old—those from more than 800,000 years ago. Through an analysis of various temperature graphs from ice cores, tree rings, and weather stations, scholars compare historical climates...
CK-12 Foundation
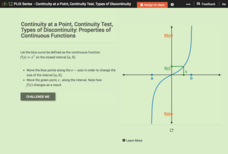
Continuity at a Point, Continuity Test, Types of Discontinuity: Properties of Continuous Functions
Take a closer look at continuous functions within given intervals. Using the parent cubic function, learners explore properties of continuous functions on intervals. Pupils interpret the Intermediate Value Theorem and the Extreme Value...
Flipped Math
Calculus AB/BC Mid-Unit 1 Review: Limits
Limit the amount one forgets about limits. A mid-unit review lesson has individuals complete a instructional activity of problems on limits. They go over the meaning of limits, evaluate limits algebraically, use graphs and tables to find...
Anti-Defamation League
Sixty Years Later
Has any progress been made in desegregating schools since 1954's Supreme Court case Brown v. Board of Education? To find out, class members examine charts and graphs representing U.S. schools' racial, ethnic, and socioeconomic...
Anti-Defamation League
Women’s Inequity in Pay: Could It Be Sexism, Implicit Bias or Both?
Equal pay for equal work? High schoolers research the reasons for the inequity in women's pay. They read articles, examine graphs, engage in discussion, and then craft an essay in which they suggest a way to address the gender wage gap.
Balanced Assessment
Number Game
It's all in the numbers! Create a mathematical model to analyze a number game and develop a winning strategy. Using a given numerical pattern, scholars write an expression to model the scenario. They then interpret the pattern of the...
Curated OER
Venn Diagrams, Part 3
Can your first graders interpret Venn diagrams? Different sets of clues help pupils narrow down a specific number in different shapes. They determine odds and evens, greater than or less than, and what shape the number is in. A fun...
Curated OER
Food chains at sea
Fifth graders interpret a table of data about food chains in the ocean. They create a food chain to represent the information on the table. Periwinkles eat seaweed, and crabs eat periwinkles - so who eats crabs? Extend the activity with...
Curated OER
Re-Presenting Race in the Digital Age
Teen-aged scientists analyze a graphic organizer of how trash is removed from New York City and then answer standard questions about a graph and a diagram. Resources are mentioned, but there are no links to these resources, so you will...
Curated OER
Worksheet 21 - Vector
In this vector worksheet students find the geometric interpretation of the change in a vector. They identify vector fields for specified functions. This two-page worksheet contains five multi-step problems.
Curated OER
Which Fish Where?
Here is a lesson plan outline that prompts elementary young scholars to graph and analyze data regarding fish caught along the Hudson River. They will review vocabulary and complete 2 worksheets which can be accessed by clicking on the...
Curated OER
Graphing in Science
Students manipulate and interpret data. They are given a dataset from a described experiment and interpret the data. A "How to Sheet for graphing" is included in lesson plan.
Curated OER
The Shortest Line Mystery
Students calculate the shortest distance of various scenarios. In this algebra lesson, students interpret graphs of optimization problems. They use a graphing calculator to assist them in graphing and making predictions.
Curated OER
Mobile vs. Money
Learners research the internet and use the information they find to plot straight line graphs. They use graphs to make comparisons of the various packages offered. Students interpret graphs and solve problems based on varying parameters.
Curated OER
Graphing Favorite Holidays
Students create spreadsheets and bar graphs based on results of survey of favorite holidays.
Curated OER
Diversity of Languages
Students interpret graphs and statistics to recognise and understand the cultural and linguistic diversity of Australia. They create a profile of the linguistic diversity of the class or school. Students discuss Australia's cultural...
Other popular searches
- Interpret Graphs and Charts
- Read and Interpret Graphs
- Graphs Interpret
- Interpret Graphs Science
- Interpret Graphs and Data
- Use and Interpret Graphs
- Interpret Graphs and Science
- Algebra Interpret Graphs
- Graphs Interpret Plot


