Illustrative Mathematics
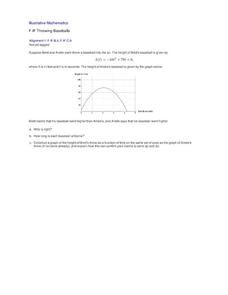
Throwing Baseballs
This is a wonderful exercise for learners to apply their critical thinking skills along with their knowledge of quadratic functions and parabolas. Young mathematicians investigate a real-world scenario about the height a baseball reaches...
Illustrative Mathematics
Coffee by the Pound
This is a great exercise in graphing proportional quantities to interpret the unit rate as the slope of a graph. It is not easy for learners to understand what a unit rate is. When it is presented as the slope of a linear line graph,...
Noyce Foundation
Truffles
Knowing how to scale a recipe is an important skill. Young mathematicians determine the amount of ingredients they need to make a certain number of truffles when given a recipe. They determine a relationship between ingredients given a...
Curated OER
Systems of Equations: What Method Do You Prefer?
Students explore the concept of solving systems of equations. For this solving systems of equations lesson, students watch YouTube videos about how to solve systems by graphing and by elimination. Students use an interactive website to...
American Statistical Association
An A-MAZE-ING Comparison
Teach your class how to use descriptive statistics through a hands-on data collection activity. Pupils collect their own data, calculate test statistics, and interpret the results in context. They compare male and female results, looking...
Mathematics Assessment Project
Representing Trigonometric Functions
Discover the classic example of periodicity: Ferris wheels. Young mathematicians learn about trigonometric functions through Ferris wheels. They match functions to their graphs and relate the functions to the context.
Curated OER
Solving Linear Inequalities
Walk the class through the steps of how to evaluate linear inequalities in one variable and graph the solution set. Define and discuss key vocabulary terms, then have individuals work problems of varying difficulty. Included are word...
Illustrative Mathematics
Invertible or Not?
Two for one—create an invertible and non-invertible function from the same data. The task presents a function table with missing outputs for the class to use to create two functions. One of the functions should have an inverse while the...
Curated OER
A Closer look at Oil and Energy Consumption
Upper graders analyze basic concepts about the consumption, importation and exportation of the worlds oil production. They create several graphs to organize the data and draw conclusions about the overall use of oil in the world.
Curated OER
Buying Cars/Financing Cars Compound Interest
Provide a real world context in which exponential functions are used to determine a eal world phenomena such as compound interest and exponential growth. This instructional activity should be taught after students have mastered the laws...
Curated OER
Applied Science - Science and Math Lab 4B
Learners experiment with the combination of vinegar and baking soda. In this applied science lesson, future scientists compare qualitative and quantitative data collected from their exploration. Then they work together to analyze and...
Curated OER
Season Worksheet #5
Sunrise, sunset, swiftly fly the years! Your earth scientists can also fly through a year of daylight data. They analyze a graph and then answer five multiple choice questions about the rising and setting of the sun, the total number of...
EngageNY
Distributions—Center, Shape, and Spread
Data starts to tell a story when it takes shape. Learners describe skewed and symmetric data. They then use the graphs to estimate mean and standard deviation.
Teach Engineering
Preconditioning Balloons: Viscoelastic Biomedical Experiments
What does stretching a balloon have to do with equilibrium? Groups explore preconditioning by stretching a balloon to a point of equilibrium. They then measure the amount of force required to stretch the balloon to the same point several...
Illustrative Mathematics
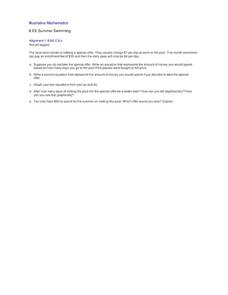
Summer Swimming
Here is a real-world application for systems of equations. When is it better to pay an enrollment fee and lower daily rate, and when is it better to pay the regular price? The local swim center is having a special offer, reductions in...
Curated OER
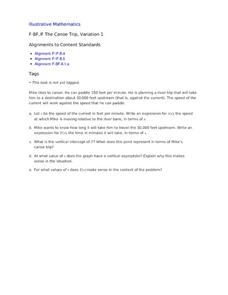
The Canoe Trip, Variation 1
Your river sportsmen will explore an example of paddling upstream as they build functions modeling speed and time in terms of the speed of the current. They then use their algebraic models to interpret features of the function related to...
Radford University
A Change in the Weather
Explore the power of mathematics through this two-week statistics unit. Pupils learn about several climate-related issues and complete surveys that communicate their perceptions. They graph both univariate and bivariate data and use...
Mathematics Vision Project
Modeling Data
Is there a better way to display data to analyze it? Pupils represent data in a variety of ways using number lines, coordinate graphs, and tables. They determine that certain displays work with different types of data and use...
Cornell University
Math Is Malleable?
Learn about polymers while playing with shrinky dinks. Young scholars create a shrinky dink design, bake it, and then record the area, volume, and thickness over time. They model the data using a graph and highlight the key features of...
Curated OER
Proportions
In this proportions activity, students solve and complete 7 various types of problems. First, they determine the better buy based on the information provided for each word problem. Then, students find the value of a variable given its...
Curated OER
Analyzing Tree Rings to Determine Climate Change
Students examine how to locate and access data sets. In this climate change instructional activity students import data into Excel and graph it.
Curated OER
The Fabled Maine Winter
Students graph and analyze scientific data. In this research lesson students use the Internet to obtain data then draw conclusions about what they found.
Curated OER
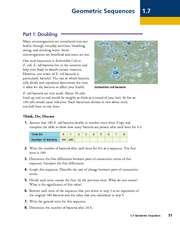
Geometric Sequences - Bacterial Growth
Bring algebra to life with scientific applications. Math minded individuals calculate and graph the time it takes a bacterium to double. They discuss geometric sequences and use a chart to graph their findings. There are 38...
Howard County Schools
Planning for Prom
Make the most of your prom—with math! Pupils write and use a quadratic model to determine the optimal price of prom tickets. After determining the costs associated with the event, learners use a graph to analyze the break even point(s).
Other popular searches
- Interpret Graphs and Charts
- Read and Interpret Graphs
- Graphs Interpret
- Interpret Graphs Science
- Interpret Graphs and Data
- Use and Interpret Graphs
- Interpret Graphs and Science
- Algebra Interpret Graphs
- Graphs Interpret Plot
