Curated OER
Heart Rate Graphs
In this graphing activity, 5th graders use a line graph to compare and contrast the heartbeats of two athletes in a tennis match.
Curated OER
Climate change in Canada
Students investigate the impact of human activity on the environment. In this secondary math/science lesson, students analyze and interpret information from data and graphs as they investigate trends in climate change and the...
Curated OER
Effects of chemical use in Agriculture
Students research environmental data to create a bar graph. In this agricultural ecology instructional activity, students research the pros and cons of chemical use in farming. Students debate on passing a law to reduce chemical use.
Curated OER
Weather Reporting
Students locate a weather map on the internet and explain or predict the weather for the following day. Students interpret the information on the weather map and pick the correct clothing to wear for that day. Students chart and graph...
Curated OER
Reactions of Photosynthesis
If you are looking for a simple quiz that delves deeper into the photosynthesis process, you found it! Fill in the blanks, graph and diagram interpretation, multiple choice, true/false, and short answer are all included in this...
Virginia Department of Education
Analyzing and Interpreting Statistics
Use measures of variance to compare and analyze data sets. Pupils match histograms of data sets to their respective statistical measures. They then use calculated statistics to further analyze groups of data and use the results to make...
University of California
Heating and Cooling of the Earth's Surface
Scholars collect data from heating sand and water before forming testable hypotheses about why sand heats up faster. Afterward, they develop and run experiments to test their hypotheses.
Beyond Benign
Orb-It
How do the products you use rate on a greeness scale? Scholars use a tool to analyze shampoos and cars for their sustainability. They consider factors that affect the environment, the economy, and equity. This is the ninth lesson in...
Prince William Network
Migration Headache
During this game, kids become migratory shorebirds and fly among wintering, nesting, and stopover habitats. If they do not arrive at a suitable habitat on time, they do not survive. Catastrophic events are periodically introduced that...
NOAA
Deep-Sea Ecosystems – Cool Corals
Young oceanographers research deep sea corals that thrive on chemosynthesis. The lesson focuses on the biology of the animal, preferred habitat, associations, and interactions.
Space Awareness
Greenhouse Effect
A greenhouse provides additional warmth and protection to the plants inside, but what if the greenhouse gets too hot? Pupils discuss and experiment with the difference between natural and anthropogenic greenhouse effect. They measure the...
Curated OER
The Blizzard of 1993
Students read and interpret the information from a barograph from a major winter storm. This task assesses students' abilities to interpret and analyze graphs, construct data tables and graphs, generalize, infer, apply knowledge of...
Curated OER
How High Are the Clouds?
Students analyze height and collect data to create a graph. In this statistics instructional activity, students use central tendencies to analyze their data and make predictions. They apply concept of statistics to other areas of...
Curated OER
Impact!!
Learners perform a science experiment. In this algebra instructional activity, students collect data from their experiment and create a graph. They analyze the graph and draw conclusion.
Curated OER
The Lake Effect
Fourth graders conduct an experiment demonstrating the effects of water and air temperature on precipitation. They create graphs demonstrating their findings using Claris Works for Kids.
Curated OER
My Test Book: Stem and Leaf Plots
In this math skills learning exercise, students solve 10 multiple choice math problems which require they interpret a stem and leaf plot. Students may view the correct answers.
Curated OER
Interpreting a Flowchart
Students examine insects place in a community. They discover the communities of insects.
Curated OER
Technology Literacy Challenge Grant Learning Unit
First graders explore counting and classification. They sort leaves, create graphs, write sentences for the data in the graphs, develop graphs for shapes, favorite animals, birthdays, and participate in a die prediction game.
Curated OER
Temperature
Students explore the concept of temperature. In this temperature instructional activity, students read thermometers in degrees Celsius. Students discuss the temperature of the seasons and what clothing they might wear given a certain...
Curated OER
Pecan Power
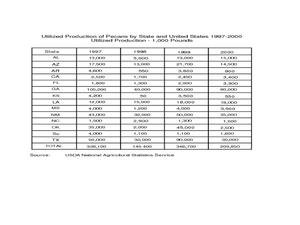
Students study the origins of pecans and complete a bar graph from the data they have discovered. In this pecan lesson plan, students draw pecans, discuss a pecan time line, and draw a bar graph comparing Arizona pecans to other...
Curated OER
Checking Test Comparability/Scattergrams
Students construct a scattergram graph. In this statistics lesson, students graph data by hand and using a spreadsheet program. They establish lines of best fit and draw conclusions using their graphs.
Curated OER
Rock Art
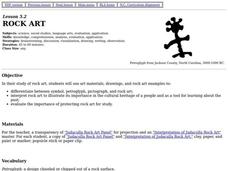
Fourth graders examine and interpret rock art to illustrate its importance in the cultural heritage of a people and as a tool for learning about the past. They create their own rock art that is a symbol of their culture.
Curated OER
Rock art
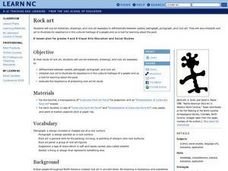
Students study rock art they use art materials, colored photographs and rock art examples to: differentiate between symbol, petroglyph, pictograph, and rock art. They interpret rock art to illustrate its importance in the cultural...
Curated OER
Interpreting Data and Building Hypothesis
Students define the term species, and graph species data together with previously collected data at the National Zoo. They interpret graphed data and recognize patterns in the streamside quadrant versus hillside quadrant. Students use...


